
10.1.0
Released January 23, 2023
Report permalinks improvements
Version 9.0.0 introduced the ability for users to copy a permalink to a specific report via a link icon in the report header. This release expands on that functionality by adding a second icon that opens the report in a new browser tab.

A related pain point in previous versions was that opening a report in a new tab from the reports list view using standard browser controls (e.g. right-clicking on the link and selecting "Open Link in New Tab" from the contextual menu) did not work as expected, causing the user to receive an authentication error in the newly opened tab. This release includes a workaround for the underlying issue, and opening reports in a new tab from the reports list view should now work as expected.
Other changes
- (Fix) Fixed a bug affecting users with Jira instances containing a large number of boards and filters from being able to select some of those boards and filters when configuring a report's data source.

10.0.0
Released January 9, 2023
- (Improvement) Upgraded various server infrastructure including migrating to a new database and database provider.

9.3.0
Released March 1, 2022

9.2.3
Released June 4, 2021
- (Improvement) Additional security hardening of Atlassian Connect lifecycle endpoints.

9.2.2
Released June 4, 2021

9.2.1
Released November 2, 2020
- (Fix) Fixed a bug that prevented report administrators from searching for available filters when configuring a saved filter as the report's data source.

9.2.0
Released September 16, 2020
- (Improvement) Performance optimizations to report data loading: reports with large data sets should now load 5-10x faster.
- (Improvement) When exporting report data to CSV or Excel, leading columns will now be added to the export automatically for any configured grouping rules.

9.1.0
Released September 9, 2020
Advanced Roadmaps support
This releases introduces initial support for Jira Premium's new Advanced Roadmaps feature (previously Jira Portfolio). The following Advanced Roadmaps fields are now available in reports:
- Team
- Parent Link
- Target Start
- Target End
Due to limitations of the Jira API, the team field will display the team name for shared teams only. For plan-specific teams, a generic team name will be displayed. To convert a plan-specific team to a shared team, see these instructions. |
Other changes
- (Fix) Users attempting to access a report via a shared permalink who do not have permission to access the report now receive a more helpful error message.
- (Fix) Fixed a bug that prevented saving report changes when only the category was modified.

9.0.0
Released July 28, 2020
Navigation refresh to align with Jira's navigation redesign
This release refreshes Limbr Reports' navigation to complement Jira's recent switch from sidebar navigation to top navigation. Like other Marketplace apps, Limbr Reports is now accessed from the Apps dropdown, and the app's menu item has been renamed from "Reports" to "Limbr Reports" for clarity.

The Apps dropdown is now the only entry point to Limbr Reports. Previously, Jira's sidebar included entry points for View reports, Create a report and Manage categories. These functions are now available on the main Reports screen via the "Create report" button and the "More actions" menu beside it. Breadcrumbs have been added to the header to improve navigation between screens.


These changes also much improve the navigational responsiveness of the app. While Limbr Reports has always been a single-page application (SPA), navigating between screens using Jira's sidebar forced a full refresh of the app's container meaning the app needed to completely reinitialize. With this release, all navigation happens within the app container and transitions between screens should be much snappier. The app is also able to better respect the browser history, meaning the browser's back/forward buttons should behave as expected.
Report permalinks
This release introduces the ability for users to copy a permalink to a specific report, allowing the report to be accessed directly in a new browser tab, saved as a browser bookmark, etc. To copy the permalink to your clipboard, simply open the report and click the link icon next to the report name in the heading.

Other changes
- (Improvement) Migrated the entire codebase to TypeScript.
- (Fix) Fixed a bug that caused the app to fail to initialize for users without a valid Jira Software license (i.e. Jira Core or Jira Service Desk only).

8.4.0
Released January 28, 2019
- (Improvement) Added field extractions for Project → Key and Project → Type.
- (Fix) Fixed a bug that caused field extractions to be empty in CSV and Excel exports.

8.3.0
Released January 27, 2019
- (Fix) Fixed a bug that caused CSV export data to be truncated.
- (Fix) Fixed a bug that prevented report administrators from removing the last shared user or shared group in the People setting.
- (Fix) Fixed a bug that caused the data loading progress to be displayed in an incorrect format.
- (Fix) Fixed a bug that prevented error notifications from being displayed in certain failure conditions.
- (Fix) Fixed a bug that prevented report admins from saving a report that did not have any settings changes.

8.2.0
Released December 16, 2019
- (Improvement) Implemented various security enhancements for compliance with the new Atlassian Marketplace Security Requirements coming into effective January 1, 2020.
- (Improvement) Added a field extraction for Cascading Select fields that allows you to display, group and sort by either the parent or child value of the select field.
- (Change) Added foundational support for upcoming "custom domains" feature in Jira Cloud.
- (Fix) Fixed a bug that truncated the clickable area of the actions button in the "View Reports" table.
- (Fix) Fixed a bug that caused the grouping header tooltip to not be displayed on hover in some circumstances.
- (Fix) Fixed a bug that caused groups to be sorted incorrectly when grouping by a user field.

8.1.4
Released March 14, 2019
- (Fix) Fixed a bug that caused the "Export to Excel" feature to fail when attempting to export a report containing columns based on date and date/time fields.

8.1.0
Released March 5, 2019
Field extractions and more supported fields
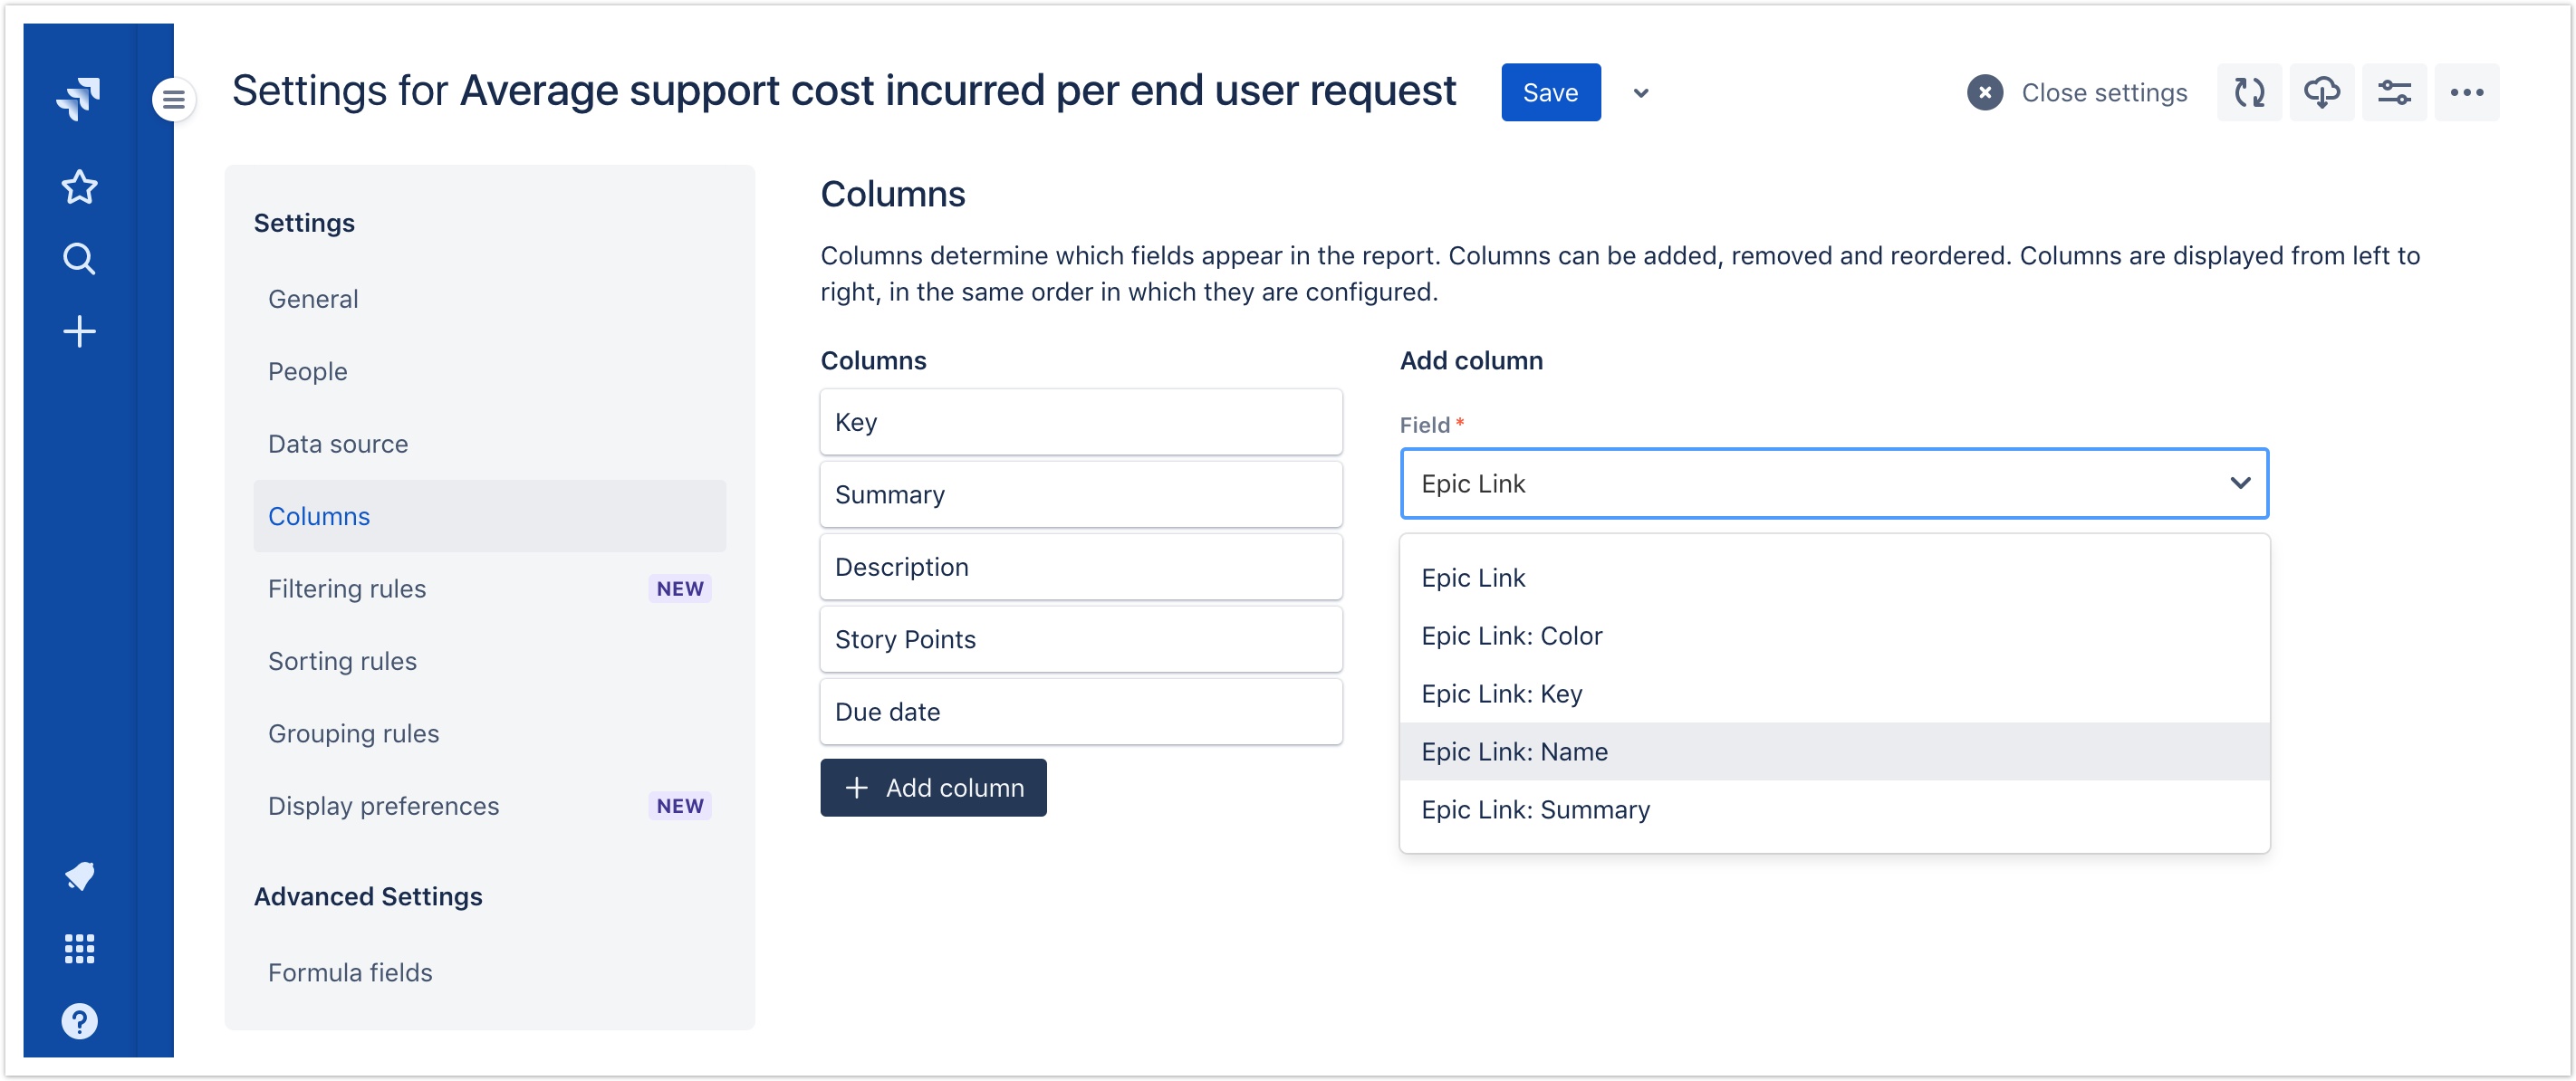
This release enables report administrators to leverage even more Jira data in their reports. Support has been added for the following fields:
- Parent Issue is now available for issues with a sub-task issue type
- Subtasks is now available for issues with a standard issue type
- Epic Color is now available for issues with the Epic issue type
Additionally, Field extractions allow the report administrator to extract nested data points that were previously inaccessible. For example, while a Jira project may belong to a specific project category, it was not previously possible to display the category in reports as "Project Category" isn't actually a field on each issue – with field extractions, Project Category will now be available just like any other field and may be displayed as a column or used in filtering, grouping and sorting rules.
Supported field extractions are as follows:
- Project → Category
- Status → Category
- Parent Issue → Issue Type
- Parent Issue → Summary
- Parent Issue → Status
- Parent Issue → Priority
- Epic Link → Issue Key
- Epic Link → Summary
- Epic Link → Epic Name
- Epic Link → Epic Color
Parameterized grouping rules
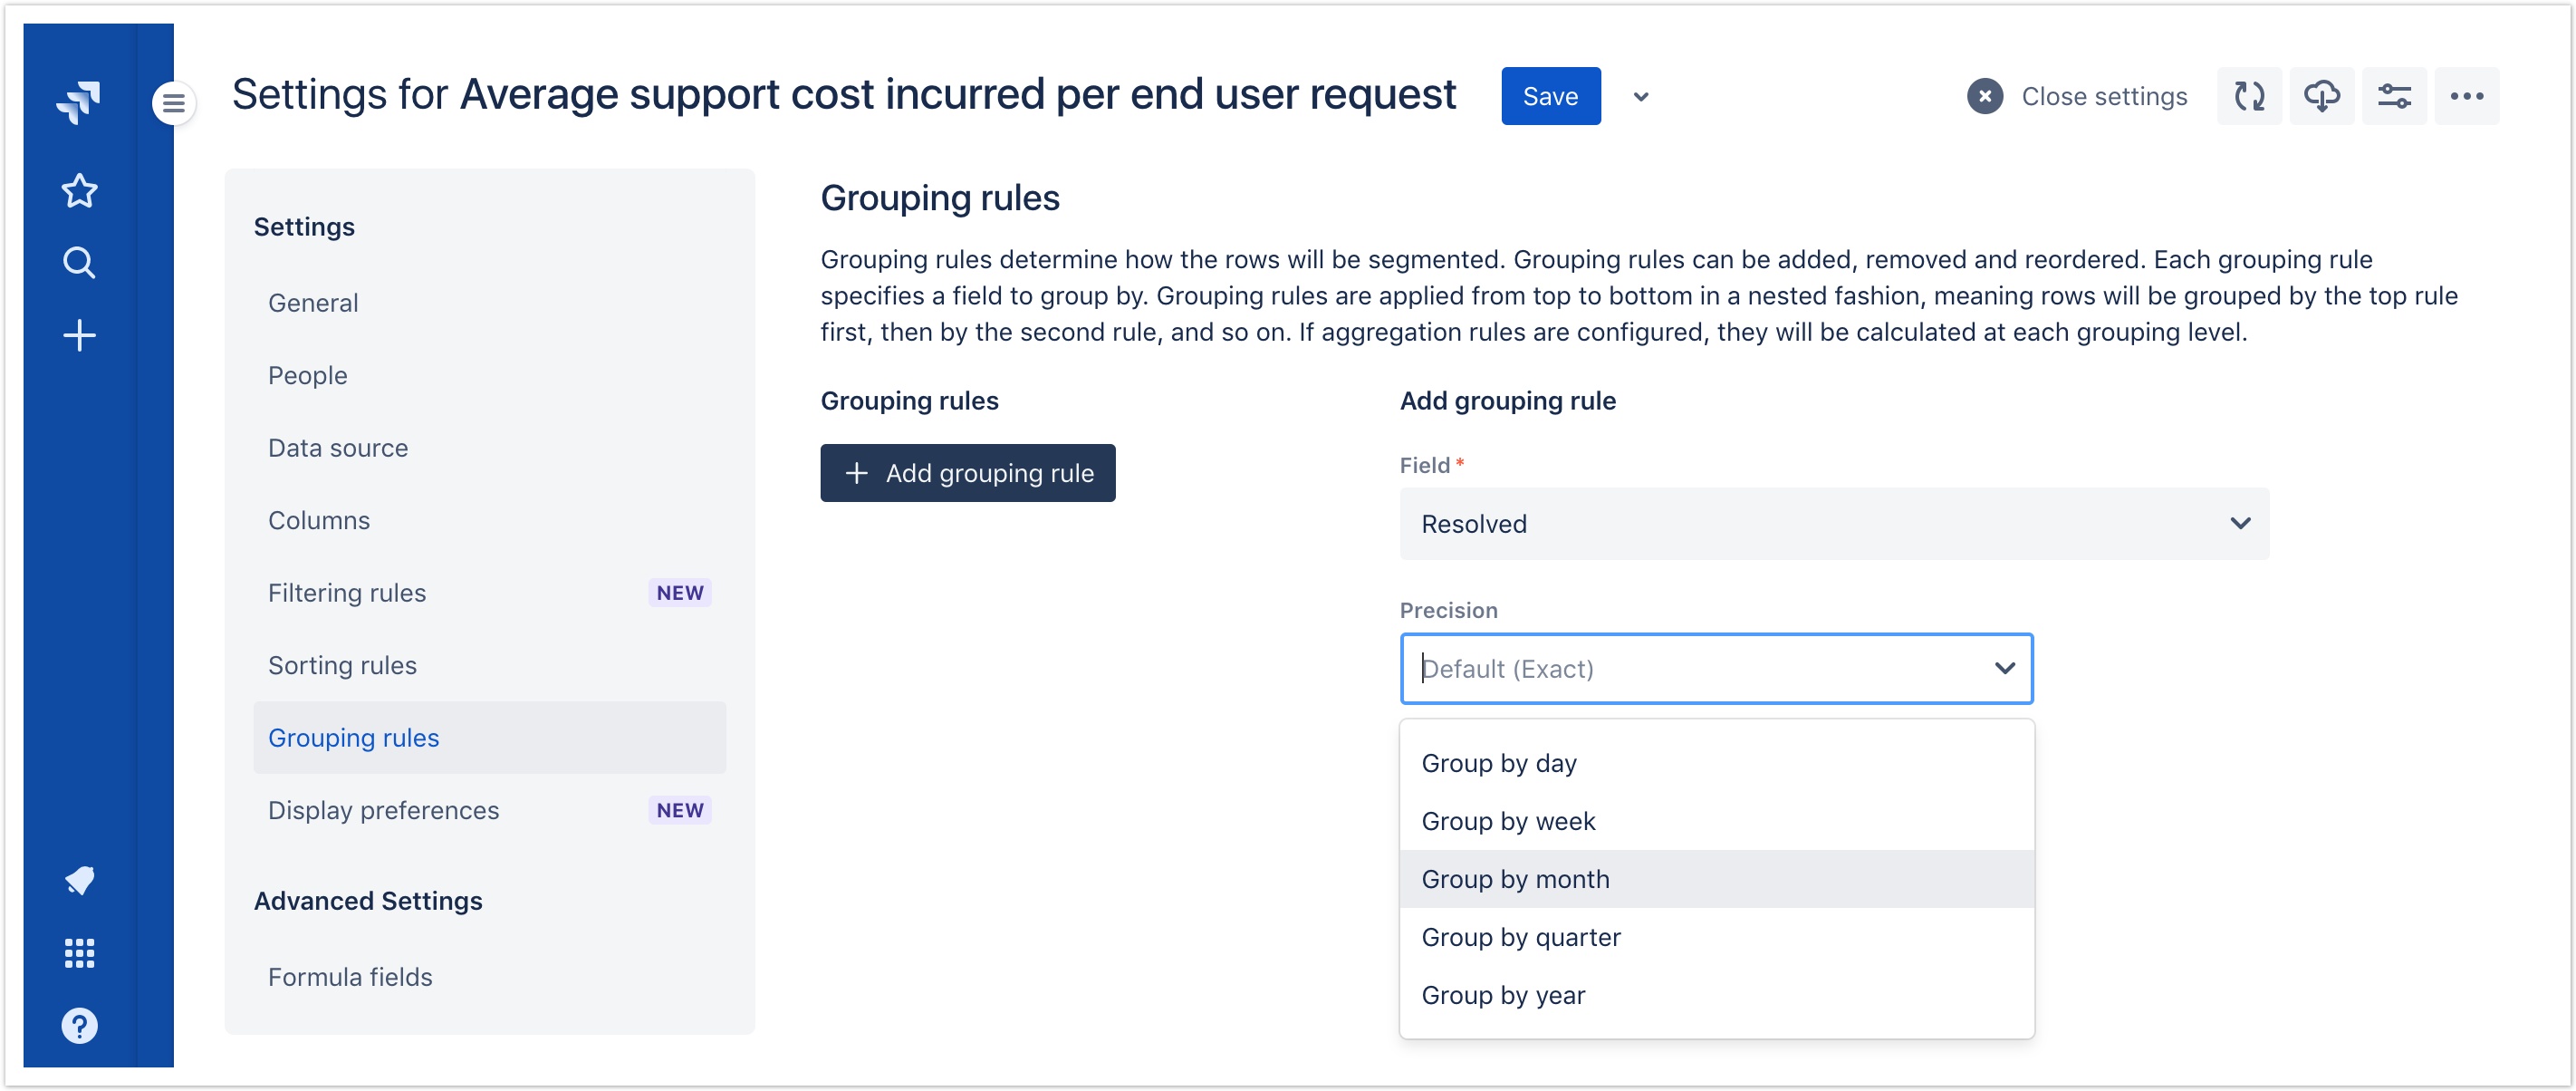
This release introduces the ability to customize the behaviour of grouping rules. Available parameters will differ based on the grouping field.
Initially, the Precision parameter is available for date and date/time fields. By default, issues grouped by a date or date/time field will be grouped according to the exact date or date/time, but report administrators can now override this behaviour and create less granular grouping "buckets" such as by day, by week, by month, by quarter or by year.
More grouping parameters will be added in future releases. Suggestions are welcome!
Display preference settings
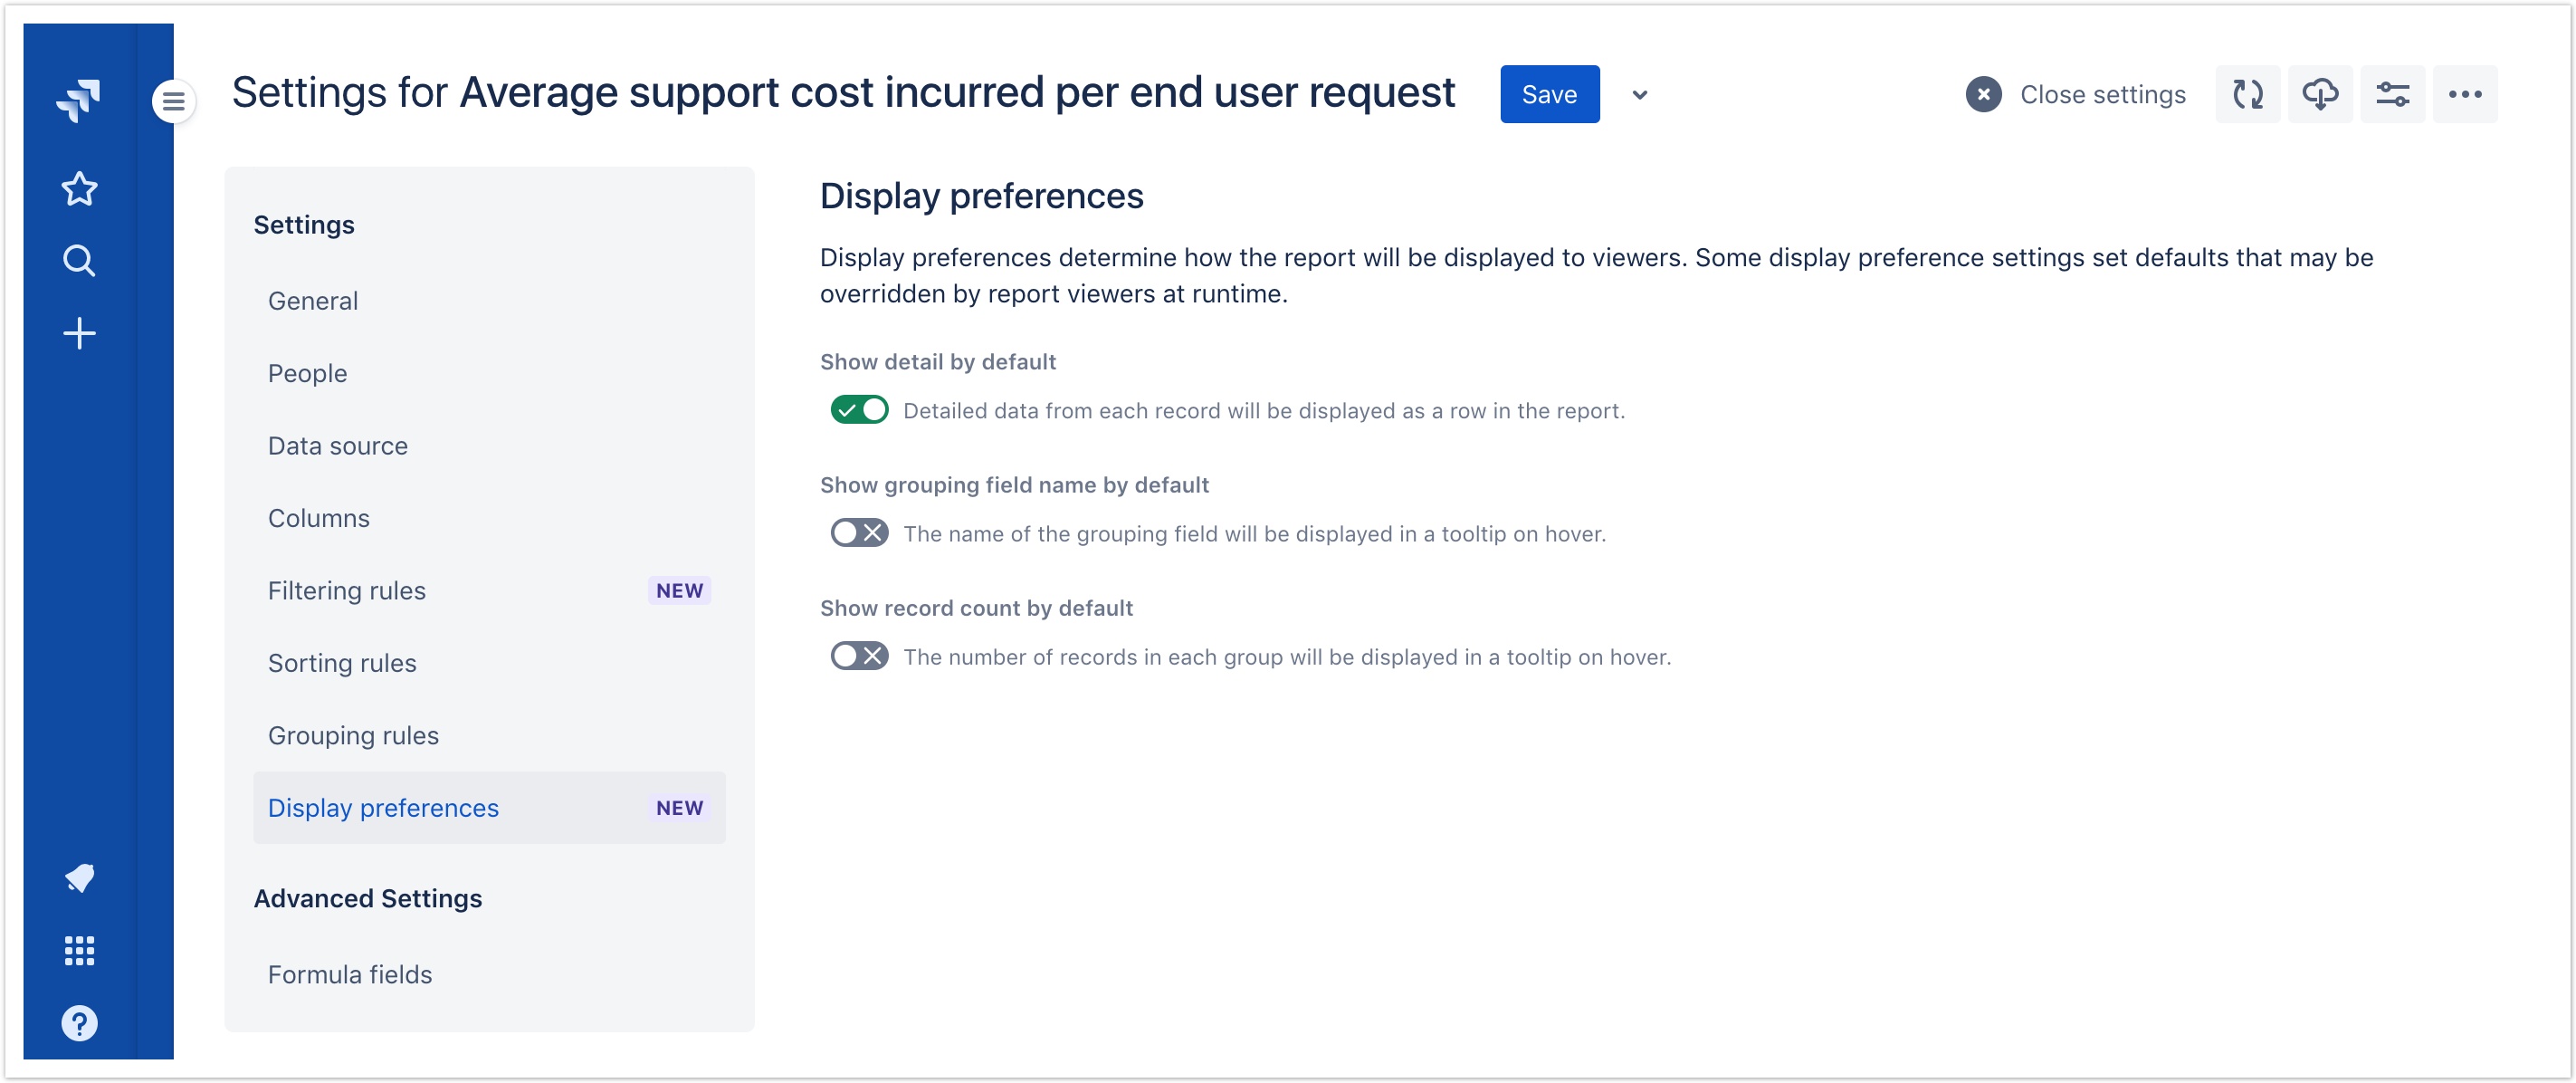
This release adds a new Display preferences settings pane containing various settings for customizing the default presentation of the report. Initially, the following display preference settings are available:
- Show detail: When enabled, each individual issue will be displayed as a row in the report and all detail will be visible. When disabled, only grouping headers will be displayed and the report viewer can drill down into each group to see additional detail as desired. This setting is disabled by default for new reports.
- Show grouping field name: When enabled, the name of the grouping field will be displayed in the grouping header. When disabled, this information will be displayed in a tooltip when the viewer hovers over the grouping header. This setting is disabled by default for new reports.
- Show record counts: When enabled, the number of issues in each group will be displayed in the grouping header. When disabled, this information will be displayed in a tooltip when the viewer hovers over the grouping header. This setting is disabled by default for new reports.
Report viewers can still override the default settings at runtime using the Display preferences button in the report header.

More display preferences will be added in future releases. Suggestions are welcome!
Other changes
- (Improvement) Polished up some rough edges that were left over from the recent user interface redesign.
- (Improvement) Performance improvements when modifying report settings while the report data loads.
- (Change) Empty aggregation values in the grouping header now display nothing instead of "N/A".

8.0.1
Released February 7, 2019
- (Fix) Fixed a bug that prevented the Create Report dialog from closing when the Cancel button was clicked.
- (Fix) Fixed a bug that caused the app not to load when the user had permission to access a report but did not have permission to access the underlying filter configured as the data source.

8.0.0
Released February 7, 2019
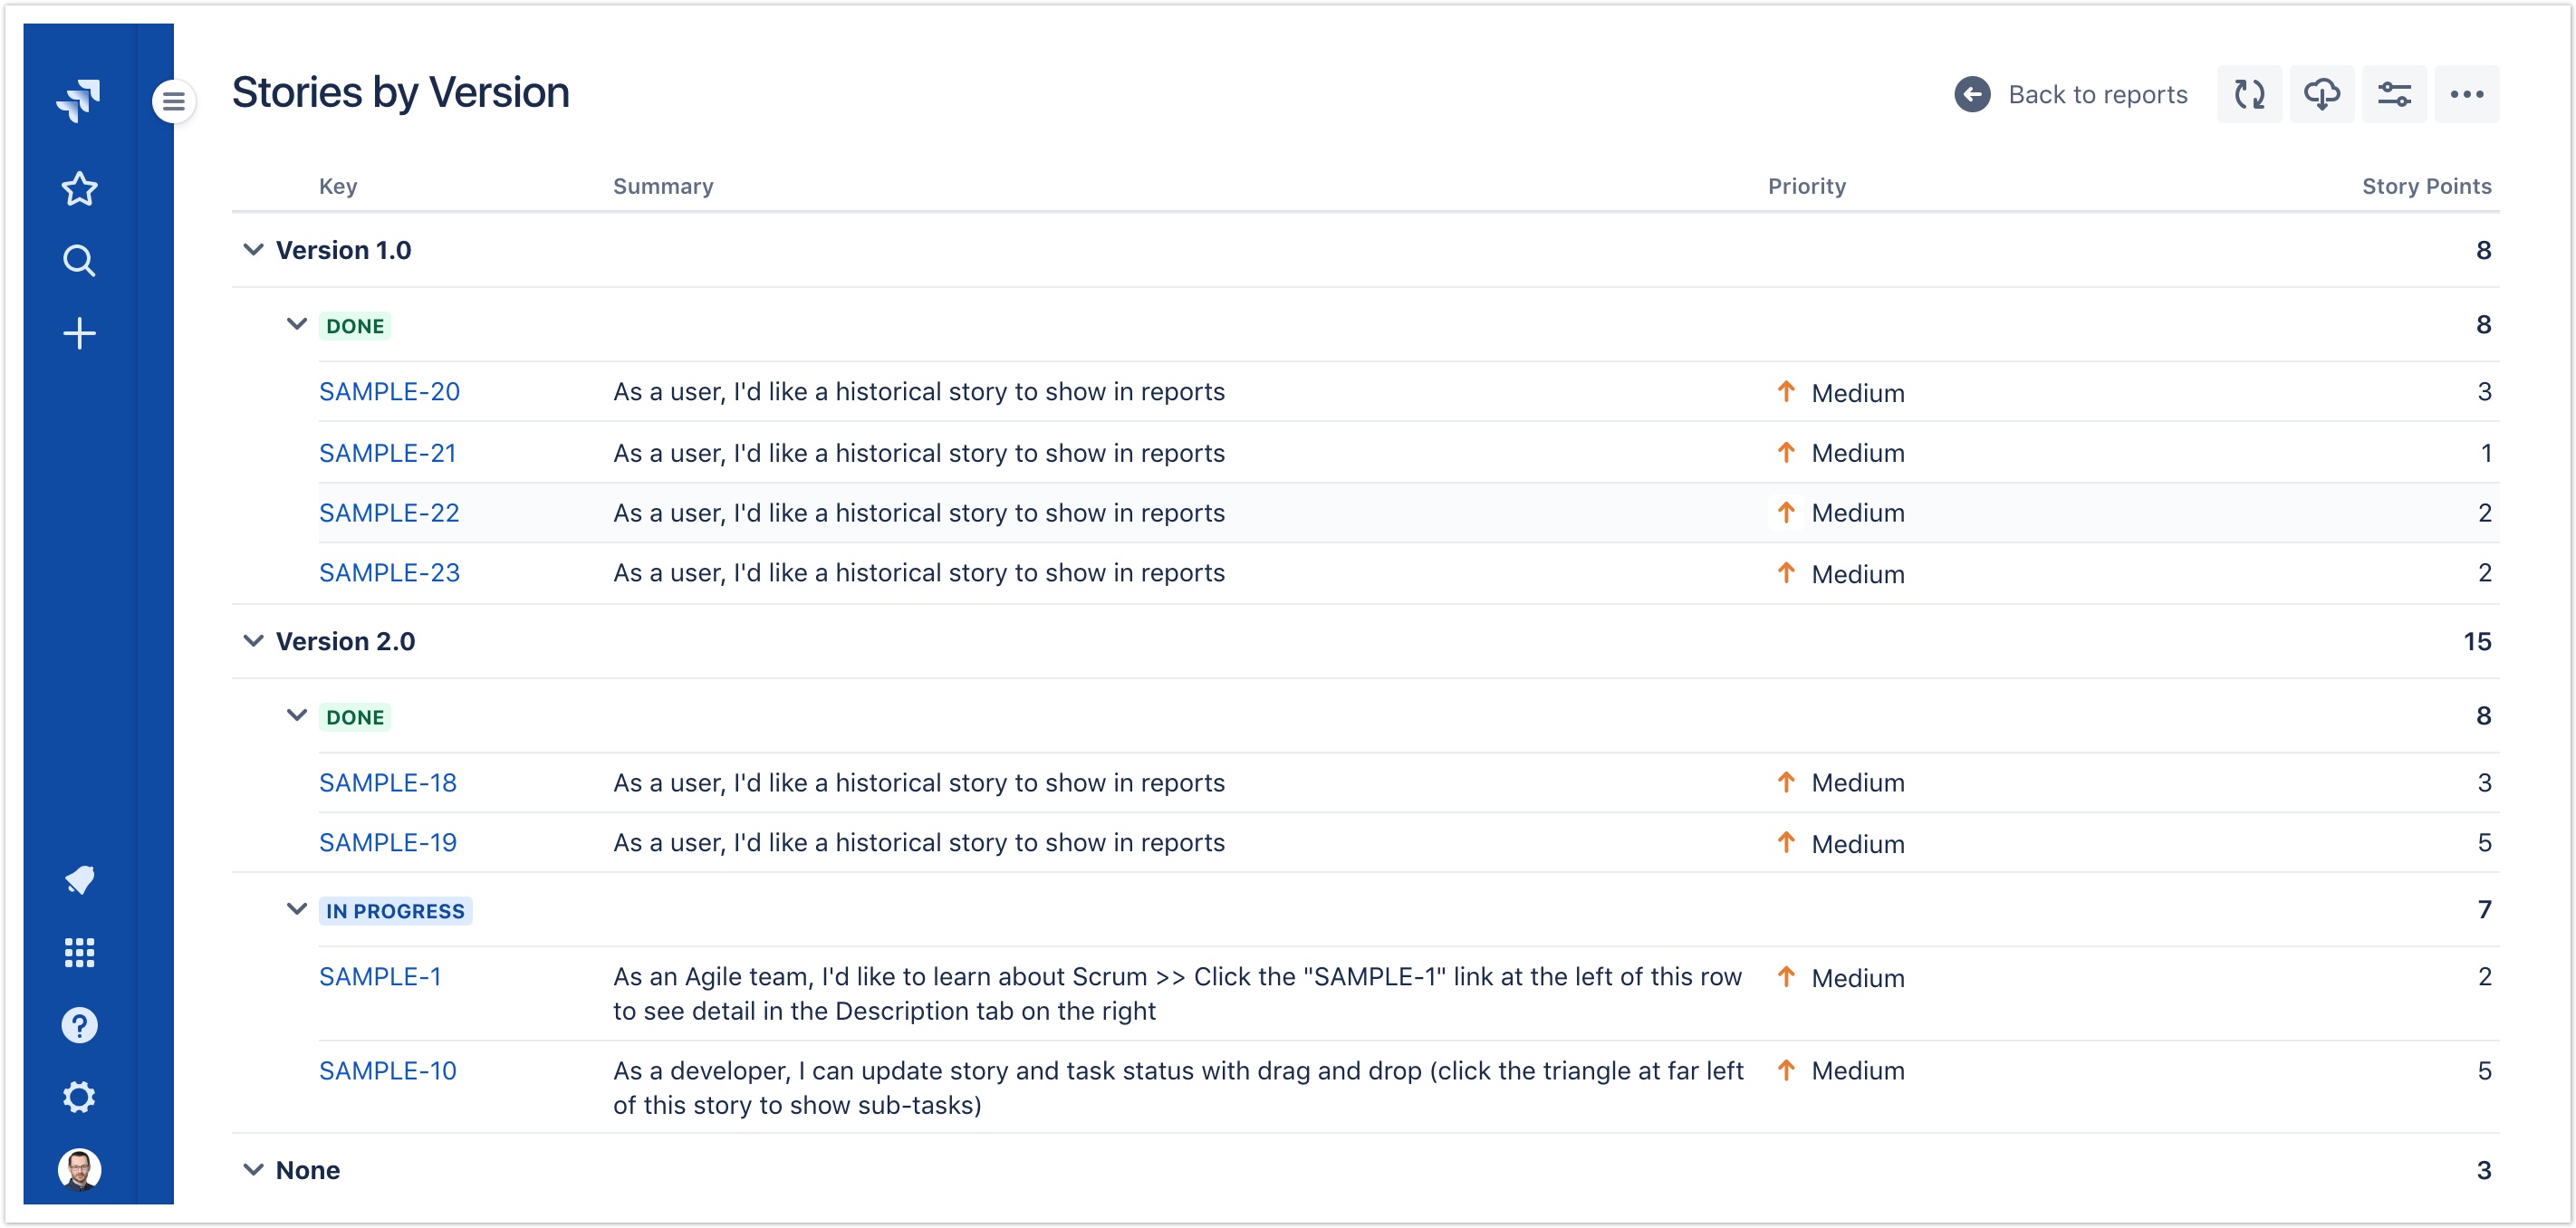
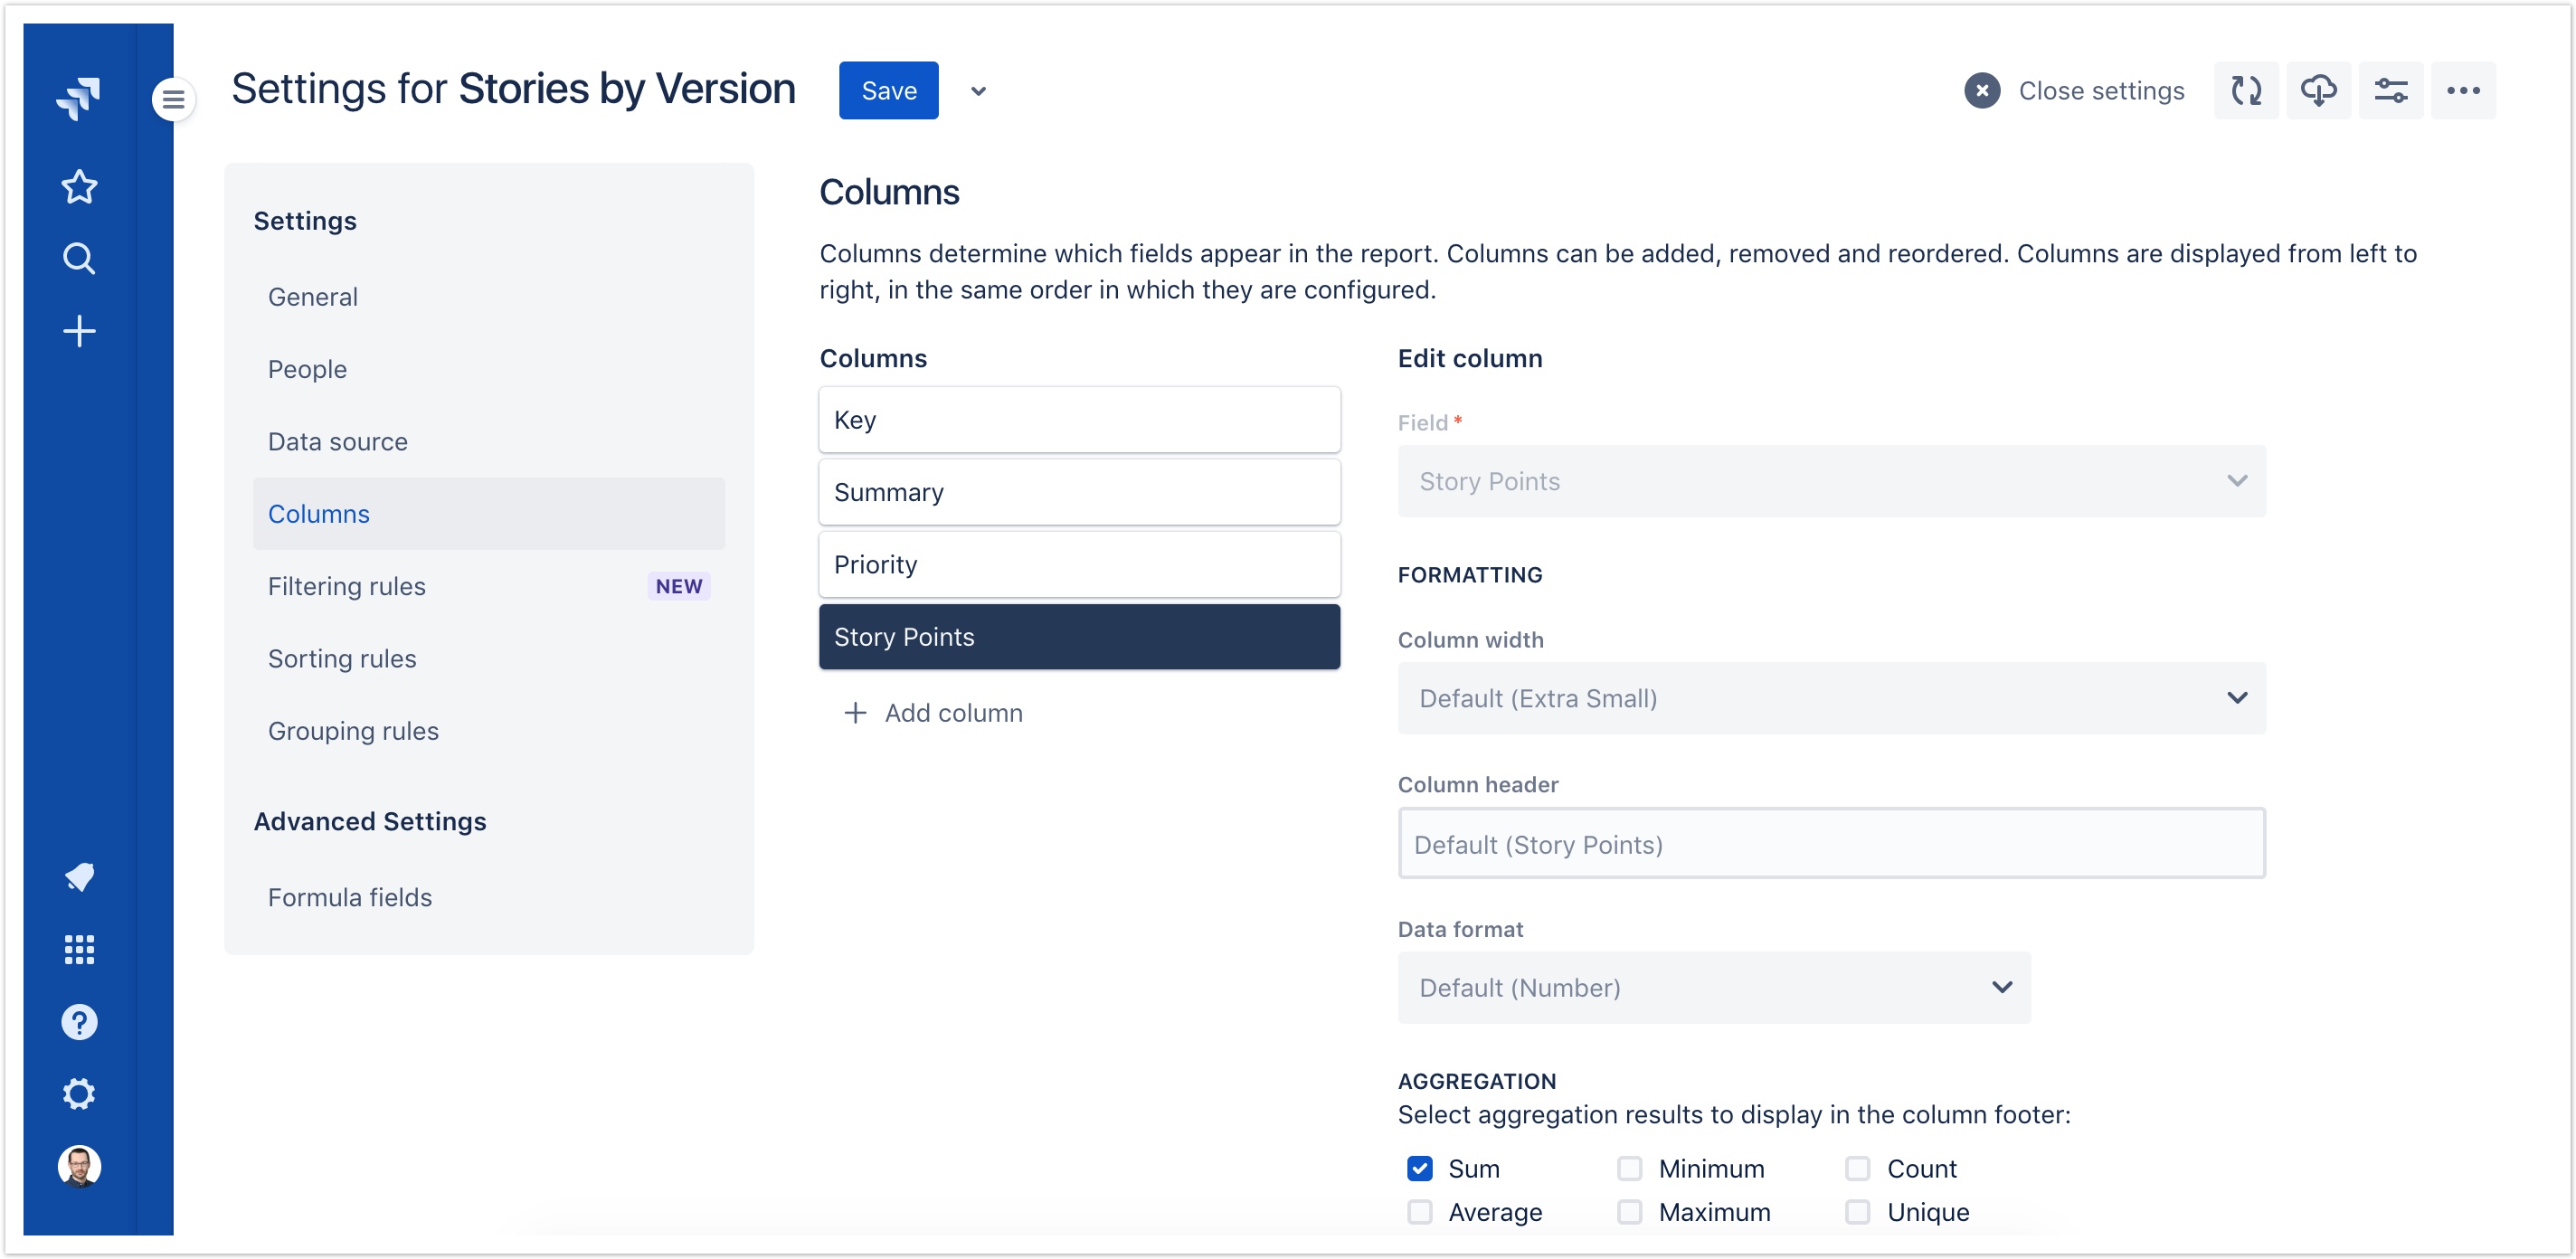
User interface redesign
This release is focused on bringing Limbr Reports into alignment with the updated Atlassian Design Guidelines standard, and virtually every detail of the app's user interface has been overhauled and polished to integrate seamlessly with the new Jira experience.
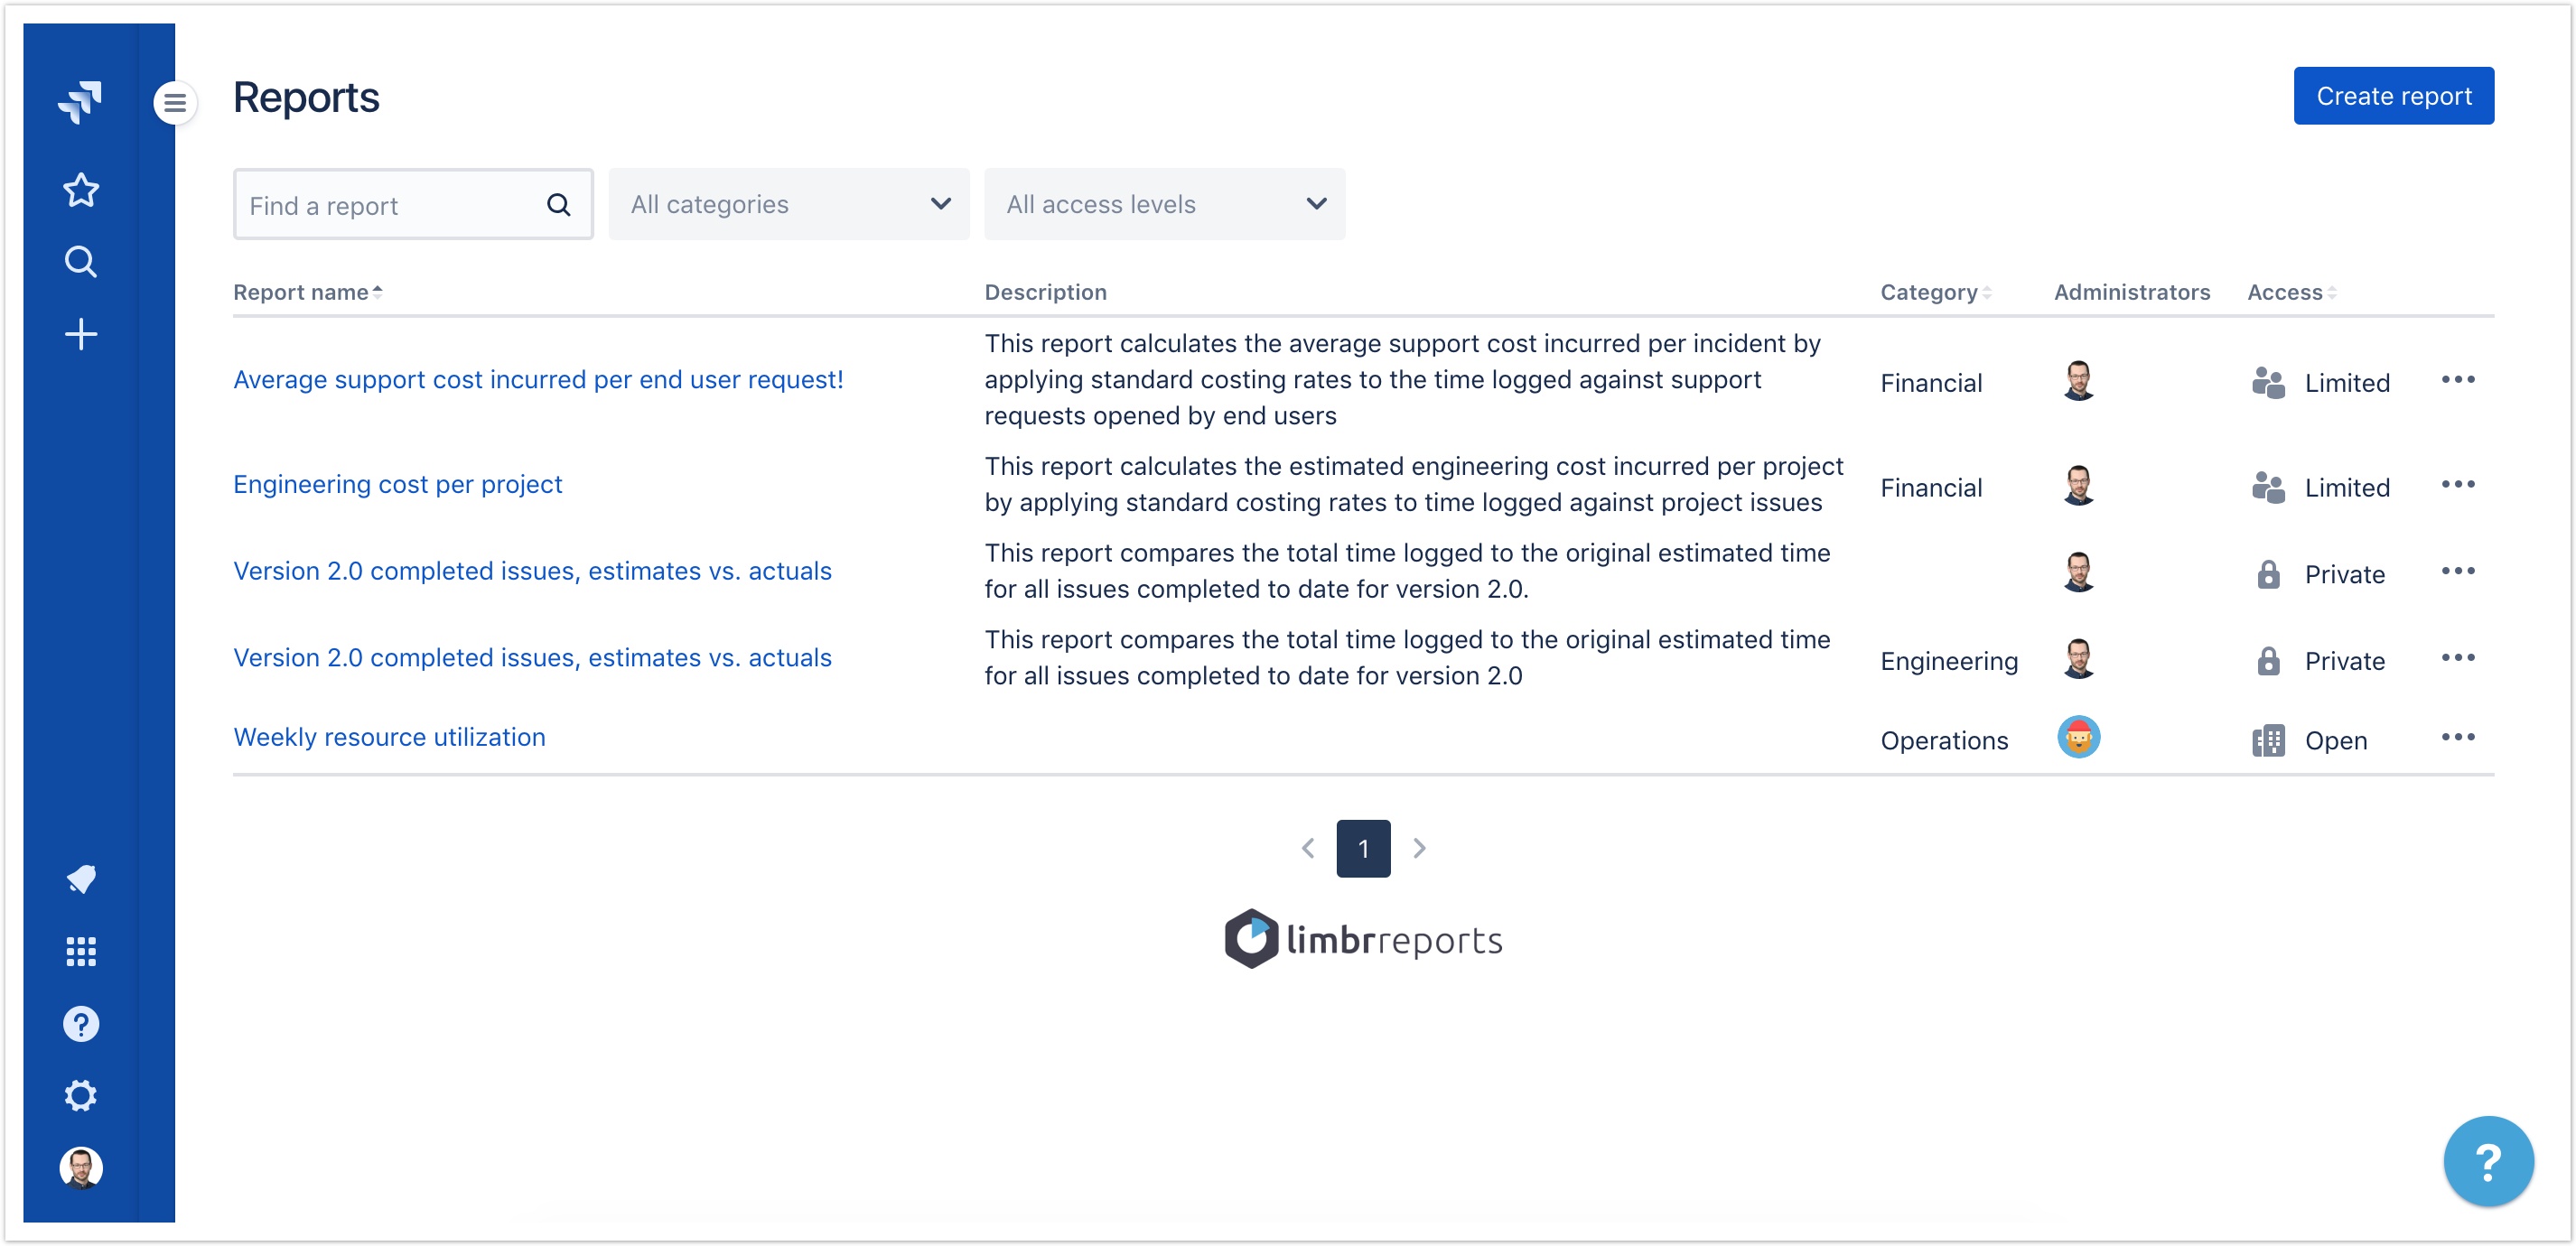
People settings
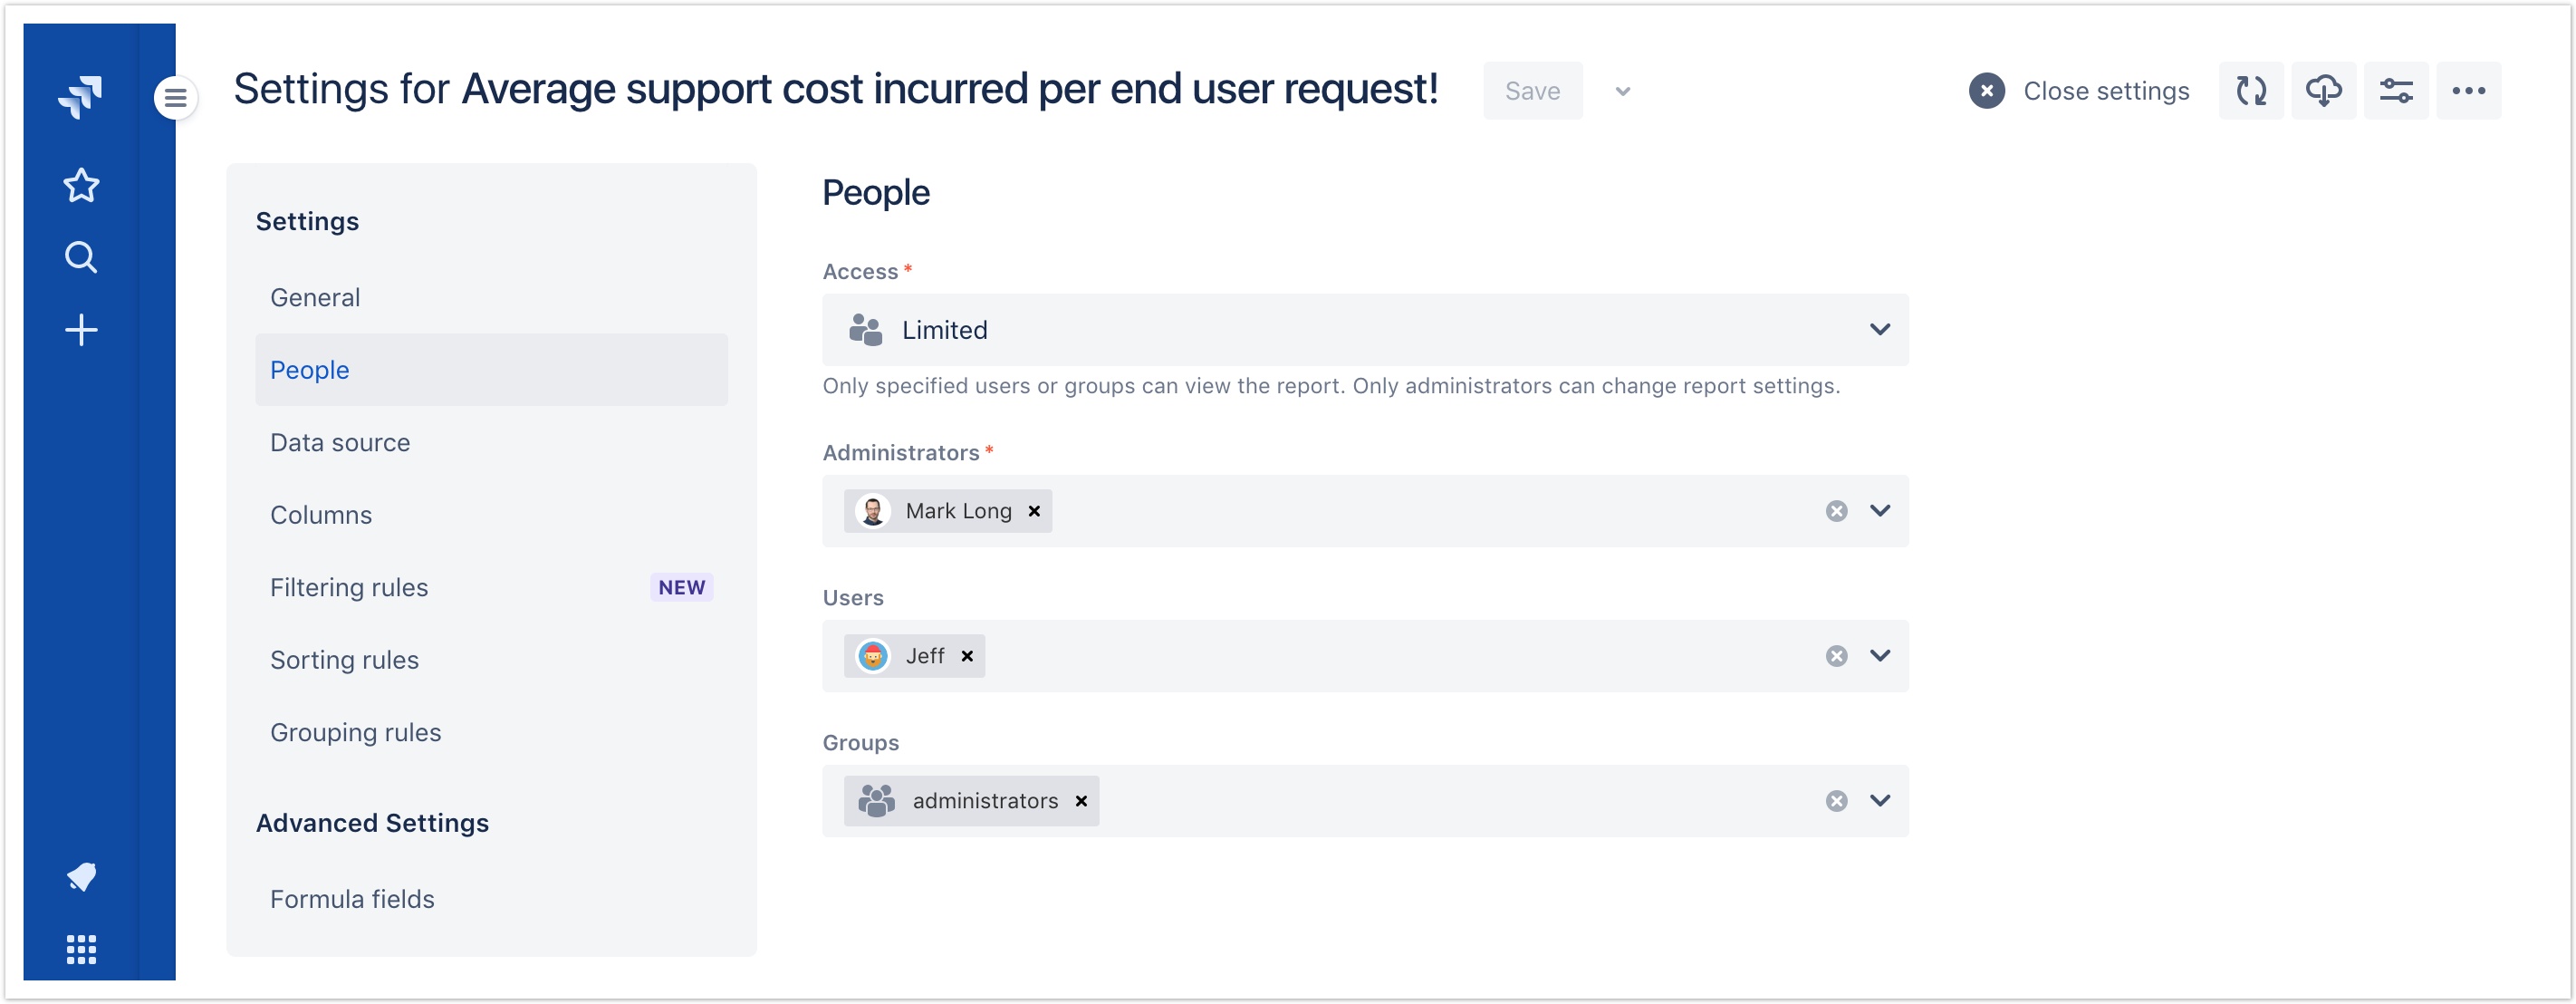
In an effort to further align with Jira's most recent user experience conventions, report administration and sharing settings have been consolidated under the People section, and the Sharing section has been removed. While the approach for determining who can view and change each report remains essentially the same, some names have changed slightly. In particular, report administrators now use the Access setting to determine the general scope of permissions:
- Open: Previously called Public. Reports configured with Open access can be viewed by any logged-in user. Only designated administrators can modify or delete the report.
- Limited: Reports configured with Limited access can be viewed only by specified users or members of specified groups. Only designated administrators can modify or delete the report.
- Private: Reports configured with Private access can be viewed, modified and deleted only by designated administrators.
Other changes
- (Fix) Fixed a bug that interfered with the ability of report administrators to make changes to settings while report data was loading.
- (Fix) Fixed a bug that prevented all users from being available in user selection fields when creating filtering rules.

7.2.0
Released December 10, 2018
- (Improvement) Building on the user privacy improvements released in 7.0.0, JQL queries configured by report administrators as a report data source will now be sanitized prior to storage on our servers – references to usernames or user keys within a JQL query will be automatically converted to the corresponding account ID. Additionally, all historical JQL queries stored on our servers have been sanitized.

7.1.0
Released December 10, 2018
- (Change) Modifications to facilitate restoration of tenant report metadata in cases where the tenant has restored their Jira instance from a backup file originating from another Jira instance.
No end-user impacting changes are expected for this release - please raise a support request if you notice something out of the ordinary!

7.0.0
Released December 8, 2018
User privacy improvements
This release implements Atlassian's guidelines for improved user privacy in advance of upcoming privacy controls in Jira and the announced deprecation of username and userKey fields throughout the Atlassian Cloud platform. Previously, users within each individual Jira instance were uniquely identified by user key, and Limbr Reports stored this metadata in order to enable user-scoped sharing rules and administration permissions for each report. Additionally, Limbr Reports logged the user key for authentication and technical support purposes. Unfortunately, it is common for the user key to contain personally identifying information (PII) such as the user's first or last name, which is not ideal for user privacy.
Recent changes to Atlassian's APIs have made it possible to uniquely identify users across the Atlassian Cloud platform by their Atlassian account ID, a randomly generated UUID that does not contain PII. As of this release, Limbr Reports uses the account ID exclusively for all use cases where identification is necessary. Additionally, all historical metadata stored on our servers has been migrated to use account ID.
No end-user impacting changes are expected for this release - please raise a support request if you notice something out of the ordinary!

6.0.3
Released November 19, 2018
- (Fix) Fixed a bug that caused user-facing server error pages to fail to render.

6.0.2
Released November 16, 2018
- (Fix) Fixed a bug that caused the decimal portion of built-in and custom number fields to be truncated when displayed in reports.

6.0.1
Released November 1, 2018
- (Fix) Fixed a bug that caused the project picker to crash on Jira instances with at least one next-gen project created.

6.0.0
Released October 31, 2018
Filtering rules
This release introduces the concept of filtering rules, which allow report administrators to exclude issues returned by the configured data source according to specified criteria. While filtering is already a core feature of Jira via JQL queries, filtering rules enable more powerful filtering capabilities such as:
- Filtering with logic that doesn't have an equivalent JQL operator or function. For example, returning all issues where the Summary starts with or ends with a given string (JQL can only return matches that contain a given string) or enforcing case sensitivity.
- Filtering date or date/time values with varying precision. For example, returning all issues where the Due Date occurs within the same quarter as the specified date.
- Filtering on formula fields. For example, creating a formula field that calculates the difference between the Original Estimate field and the Time Spent field and then filtering to return only those issues where Time Spent exceeds Original Estimate.
 Filtering with field-to-field comparisons. For example, returning all issues where the Resolution Date is greater than the Due Date.
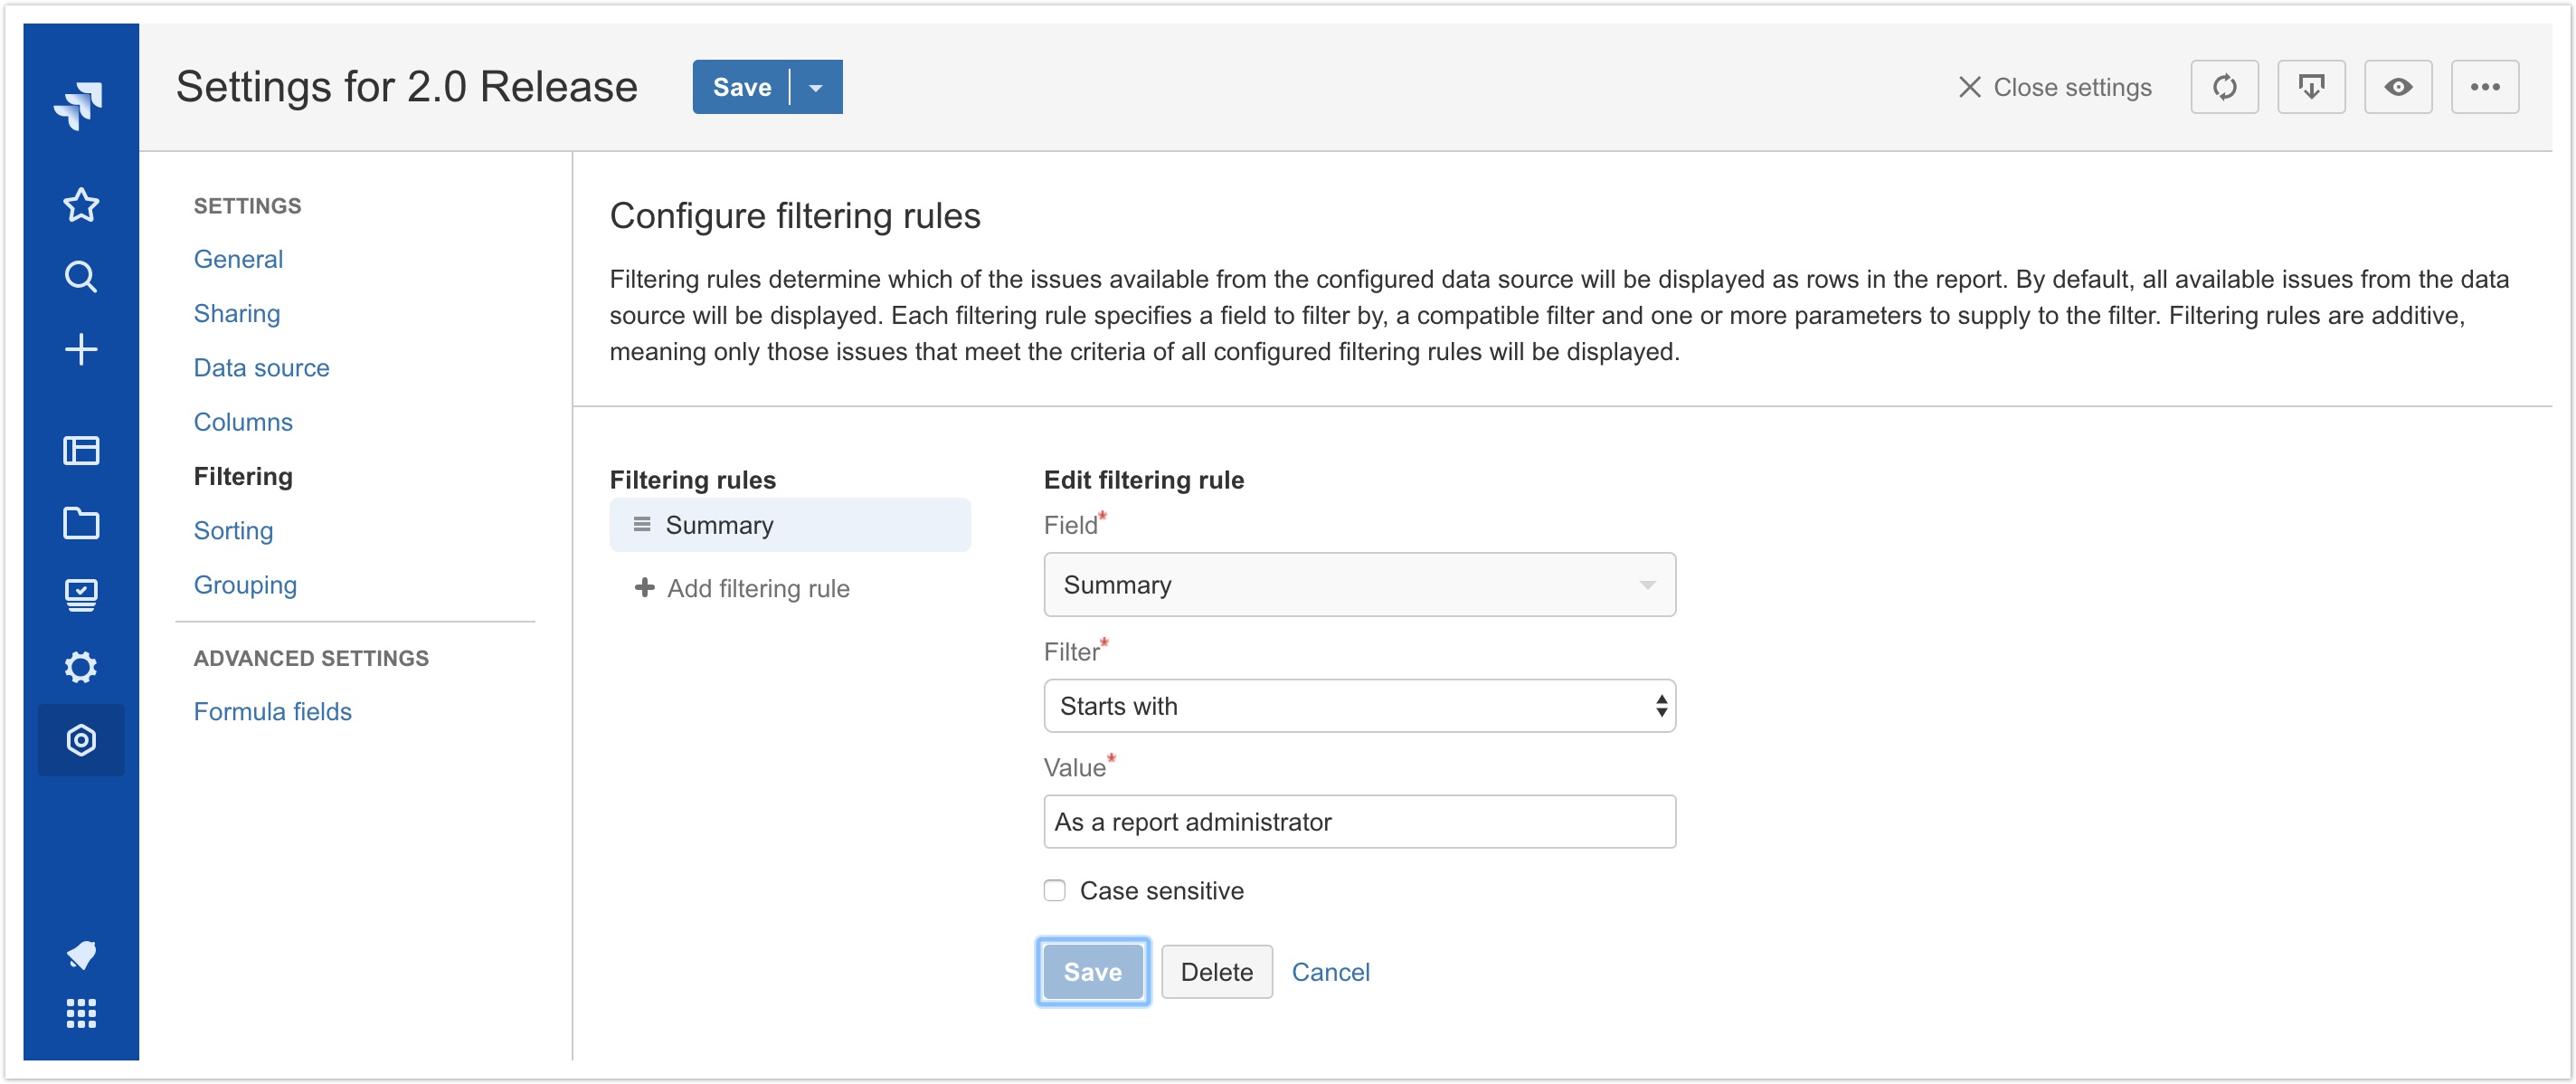
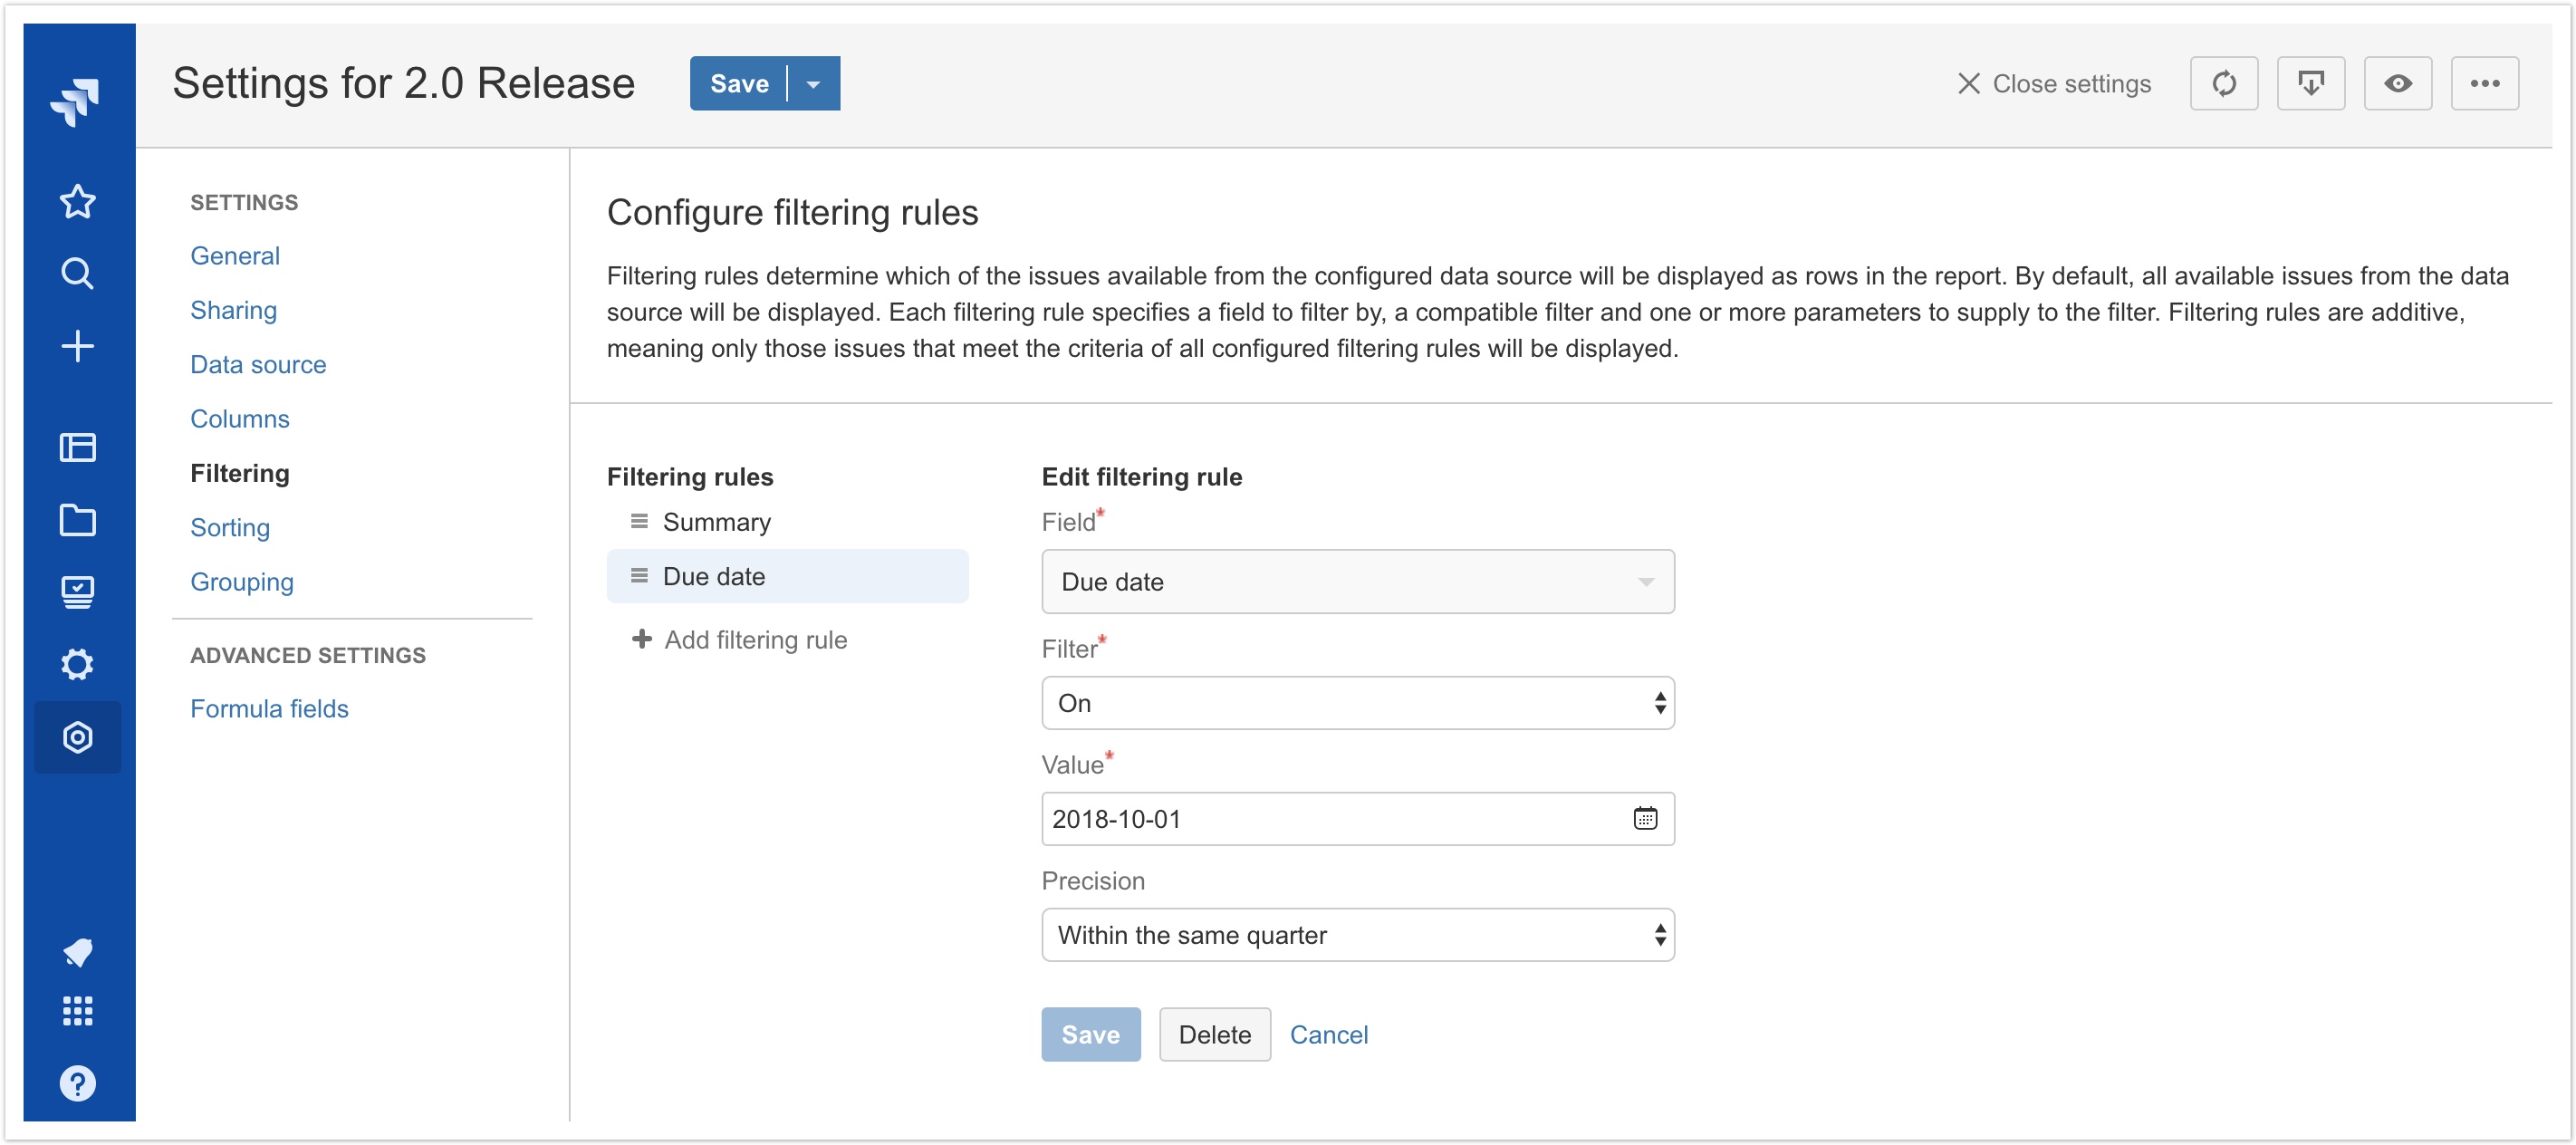
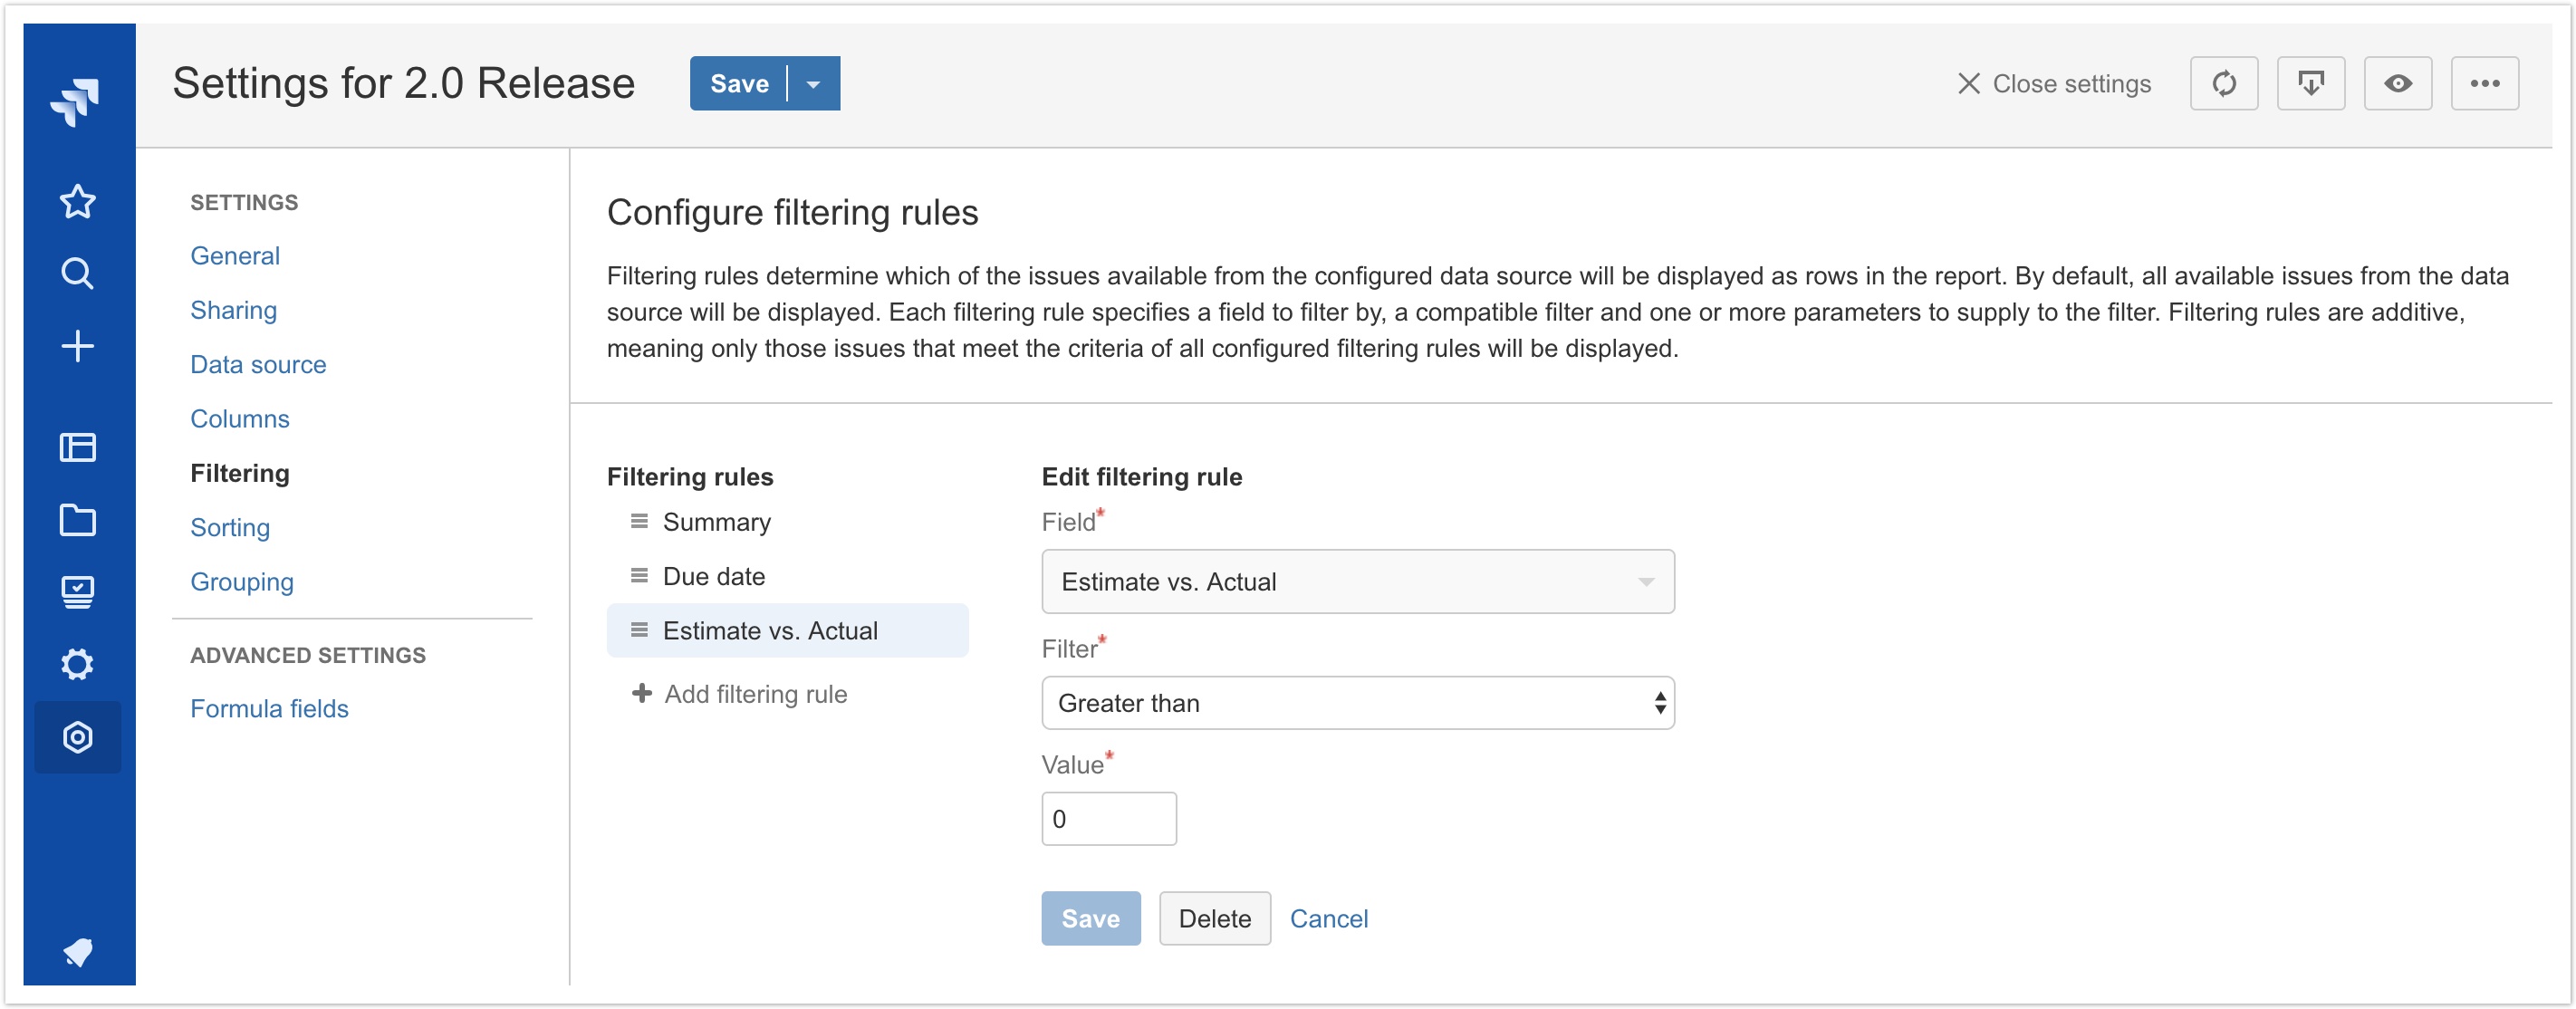
In this initial release of filtering rules, the following field types and filters are available:
- Text fields (built-in and custom)
- Equal to / not equal to
- Contains / does not contain
- Starts with / does not start with
- End with / does not end with
- Is empty / is not empty
- Number fields (built-in, custom and formulas)
- Equal to / not equal to
- Greater than / less than
- Greater than or equal to / less than or equal to
- Is empty / is not empty
- Date and date/time fields (built-in and custom)
- On / not on
- After / before
- On or after / on or before
- Is empty / is not empty
- User fields (built-in and custom)
- Equal to / not equal to
- Is empty / is not empty
- Project fields (built-in and custom)
- Equal to / not equal to
- Is empty / is not empty
Additional field types and filters are under active development and will be released in the future. Please send a suggestion or feedback if you have a particular filtering use case that you'd like to see supported or if something isn't working as expected.
Cancel data loading
It's now possible to abort long-running data fetches. This is particularly useful when configuring settings of a report that fetches a very large data set, as the data loading process can be quite resource intensive and may cause the browser to be temporarily non-responsive, thus preventing the user from applying setting changes. To cancel the data loading process, simply click the "Cancel" button in the bottom right corner of the data loading status indicator.

To restart the data loading process, click the Refresh report data button in the report toolbar.

Other changes
- (Improvement) This release further refines the user interface for configuring report settings. Drag-and-drop reordering of rules has been reintroduced with a faster and more reliable implementation, form validation is more robust, and a few things have changed under the hood to allow for multiple rules based on the same field to support filtering rules and a couple of other upcoming features.
- (Change) Formula fields have been used in production since May 2016, and have proven both reliable and useful for a variety of use cases. Additionally, the user interface improvements in this release make it easier for report administrators to configure formula fields. Therefore, the feature has officially graduated from Labs status in this release.
- (Change) Added a custom app icon to the Jira navigation sidebar to more easily distinguish Limbr Reports from other add-ons when the sidebar is collapsed.

5.2.0
Released March 6, 2018
Export to Excel
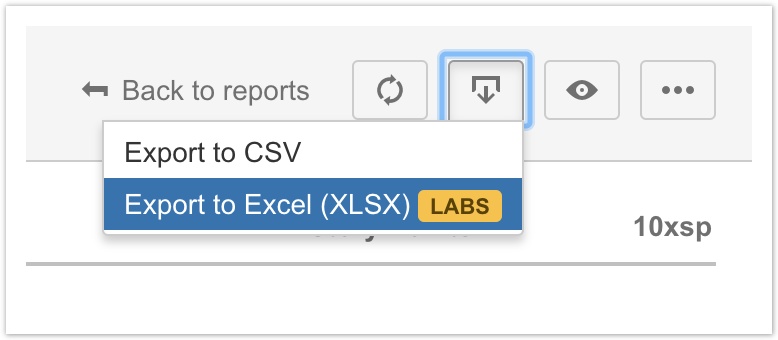
This release adds the ability to export reports to Excel (XLSX) format. While Excel readily imports CSV format as provided by the existing export feature, it doesn't consistently detect the appropriate data type for columns containing numbers and dates, which can make it difficult for users to reference report data in formulas, charts, etc. This new export option produces a file comparable to the existing CSV export, but in native XLSX format with the additional metadata to help Excel correctly detect the data type of each column.
Export to Excel is currently a Labs feature, meaning it is considered to be a work-in-progress. While the feature should be quite stable and usable, we are interested in user feedback to help further polish the experience in upcoming releases. |

5.1.4
Released January 25, 2018
- (Fix) Fixed a regression that caused configured settings to not be properly copied from the source report to the new report during Copy and Save As operations.

5.1.2
Released October 31, 2017
- (Improvement) Streamlined data fetching for reports containing Epic Link or Epic Name fields.
- (Improvement) Made ingestion of Jira API data more robust in order to prevent potential bugs related to the same root cause that necessitated the emergency hot fix released in v5.1.1.

5.1.1
Released October 30, 2017
- (Fix) Emergency hot fix to resolve a problem that caused reports containing Epic Link or Epic Name fields to fail when fetching Epic data from Jira. See incident details for more information.

5.1.0
Released October 26, 2017
- (Improvement) Added Jira Service Desk help widget to surface documentation articles and the ability to create a support request directly without leaving the application.

5.0.3
Released September 21, 2017
- (Fix) Emergency hot fix to work around an unexpected change in Jira API throttling behaviour that caused reports with large data sets to load only a fraction of the issues. Please note that this necessary change will likely impact load time performance due to a 10x increase in the number of network requests that must be made to fetch the same volume of data.

5.0.1
Released August 9, 2017
- (Fix) Fixed a regression that broke formula fields which referenced other formula fields in the formula or rollup expression.

5.0.0
Released August 8, 2017
This release is the first of several upcoming releases focused on offering report administrators more fine-grained control of the presentation of their reports.
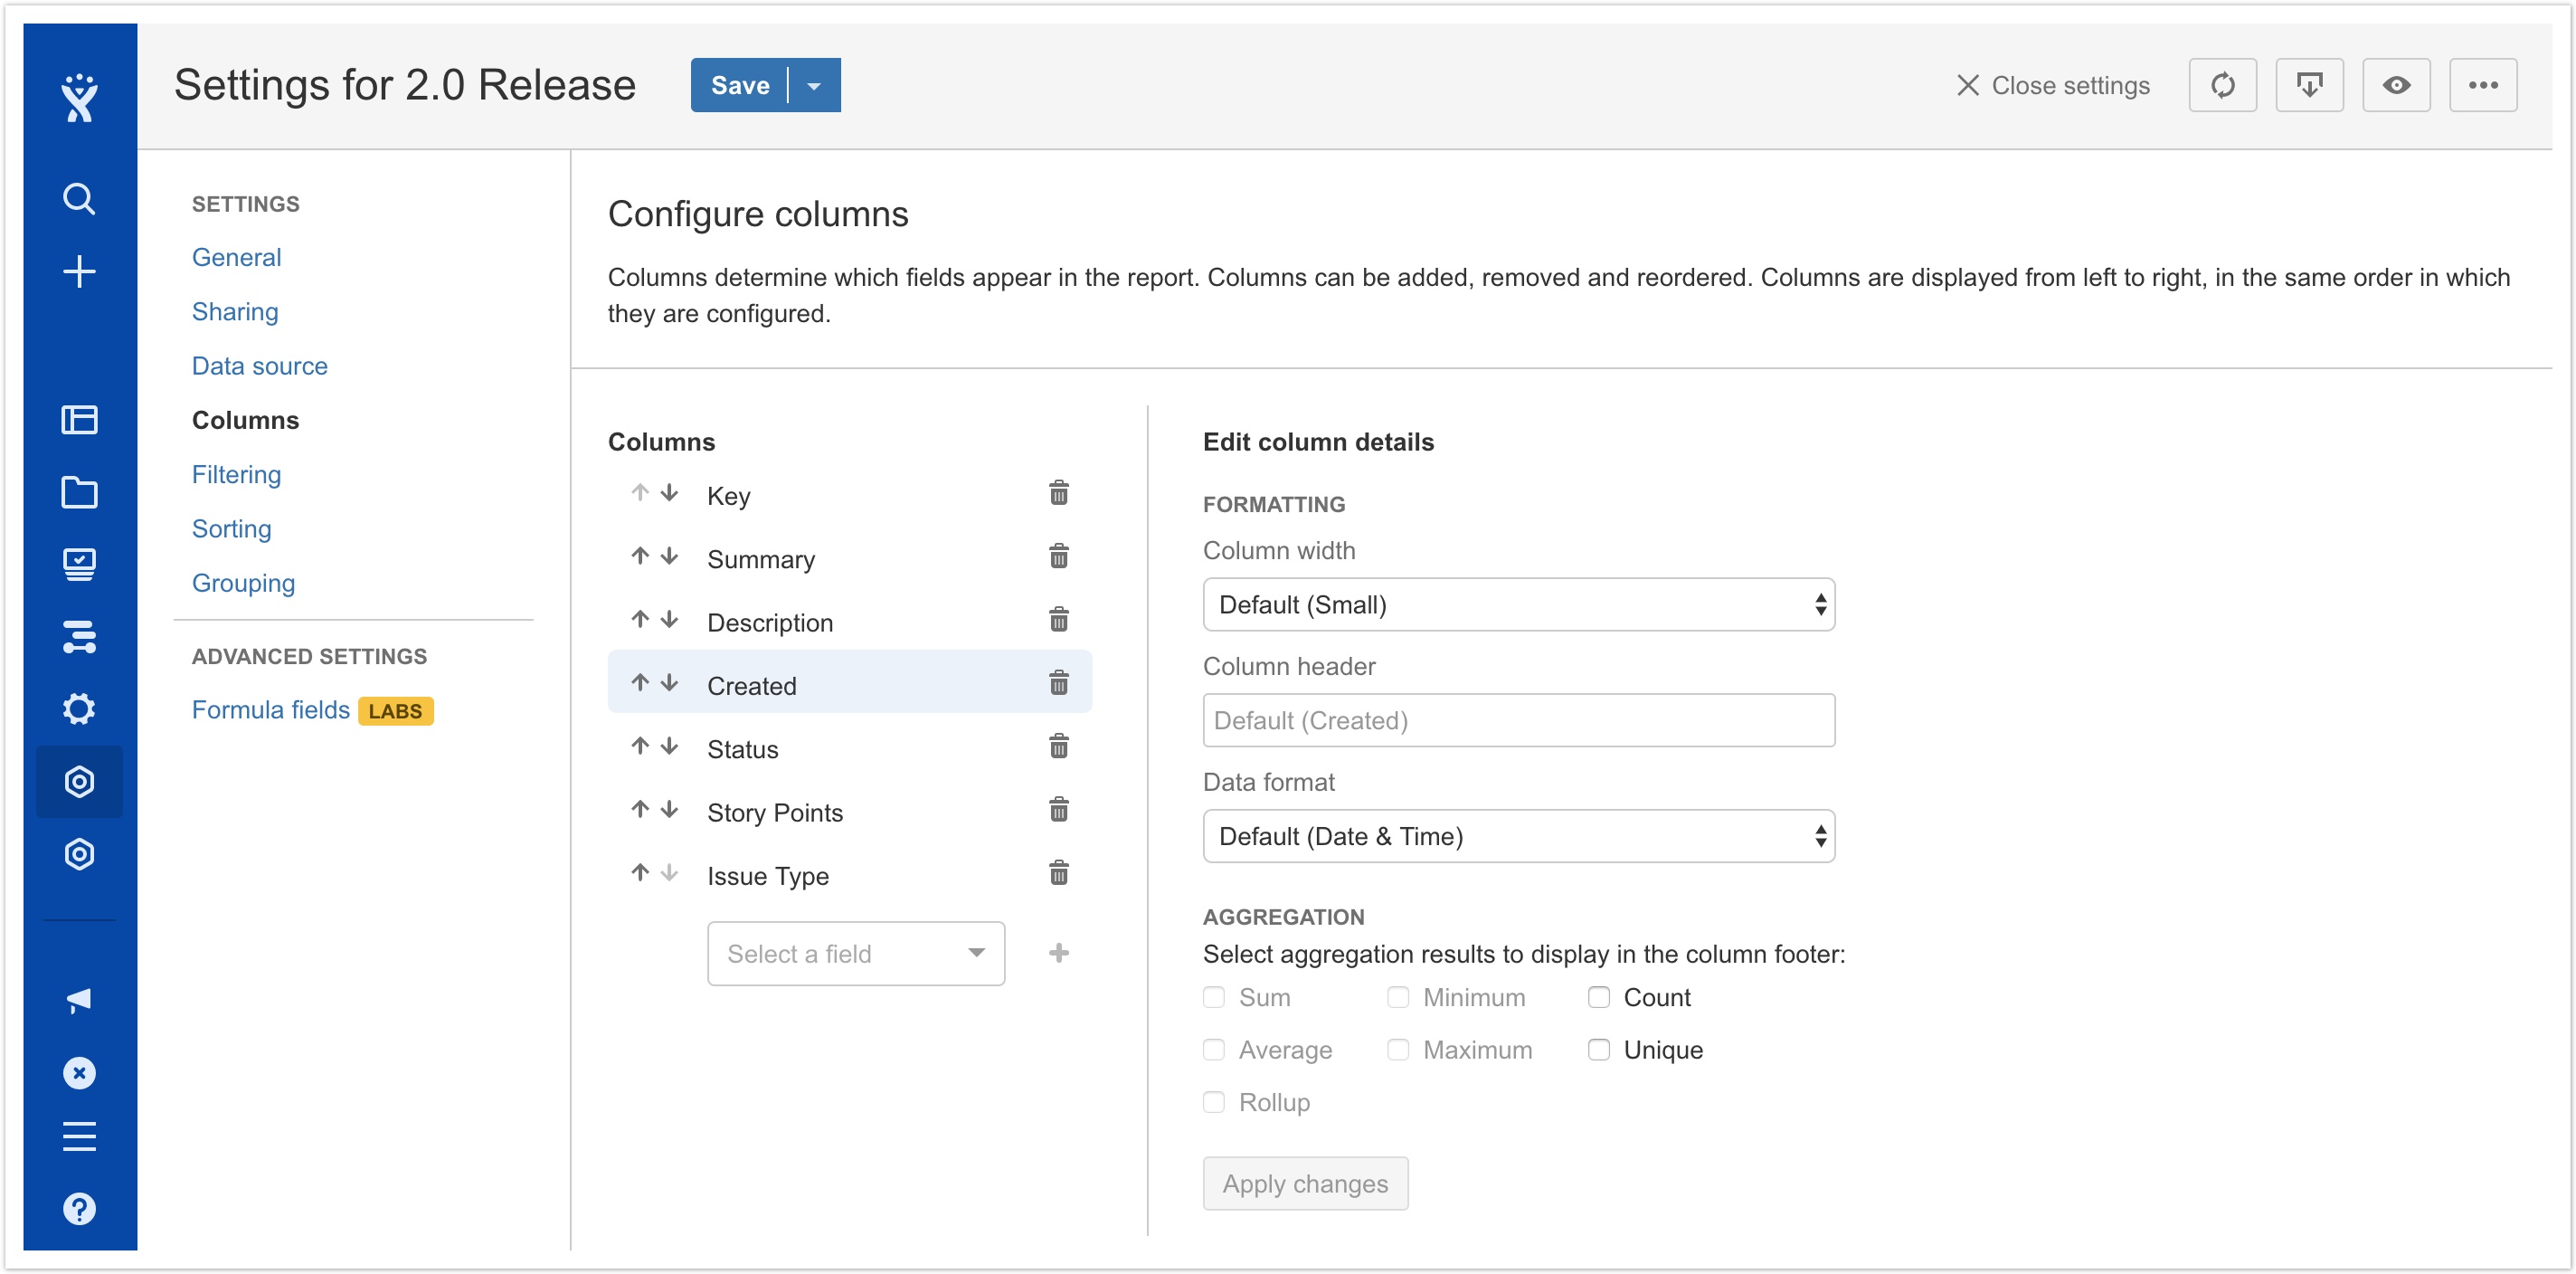
Column formatting
The column configuration interface has been redesigned with a two-pane layout, exposing the ability to configure formatting options for each column. In this release, report administrators can:
- Override the default column width by selecting one of five width options ranging from extra small to extra large.
- Override the default column header by entering a new header of their choice.
- Override the default data format, if available.
The following data formats are currently available:
- For generic number fields: Number, Percentage, Currency and Duration.
- For generic date/time fields: Date & Time, Date Only and Time Only.
- For JIRA's built-in time fields (e.g. Original Estimate, Time Spent): Duration and Number.
- For Limbr Reports formula fields: Formula and Number.
Selecting a different data format will change the presentation of row values in the report both on-screen and in exported CSV files.
Aggregation enhancements
This release includes three significant changes to aggregations:
- Two new aggregation operations are now supported: Count and Unique. Count reflects the number of rows containing non-empty values for the specified field, while Unique reflects the number of rows containing unique values for the specified field. While other operations are only available for number fields, Count and Unique are available for all field types.
- Previously, aggregation calculations were only performed if an aggregation rule was configured by the report administrator. Now, all supported aggregations are automatically calculated at report runtime. This change enables aggregated values to be referenced in rollup expressions regardless of whether the aggregated value will be displayed in the report for viewers.
- Display of aggregated values is now configured alongside other formatting controls in the column details section.
Other changes
- (Change) The user interface for configuring grouping and sorting rules has been updated to match columns, paving the way for configuring additional grouping and sorting details in a future release.
- (Improvement) Polished up presentation of aggregation data in the report: eliminated text overlap issues; ensured consistent alignment between grouping levels; various other visual tweaks.
- (Fix) Fixed a nasty crash affecting new users creating their first report.

4.3.0
Released July 21, 2017
- (Improvement) Added support for new Tempo Timesheets Cloud fields: Team and Account.
- (Improvement) Added support for JIRA Service Desk fields: Request Type, Request Participants, Organizations, Satisfaction Rating, Satisfaction Date, Approvals and Approvers.
- (Improvement) Added support for JIRA Core fields: Progress, Votes, Watchers, Custom Group Picker (Single) and Custom Group Picker (Multiple).
- (Fix) Fixed a bug where grouping by a field containing one or more empty values would sometimes display nothing in the grouping header rather than "None".
- (Fix) Made the Average aggregation more accurate by excluding rows with field empty values from the count.

4.2.3
Released July 18, 2017
- (Improvement) Improved handling of cases where the JIRA API is not responding - appropriate errors are now displayed to the user rather than a perpetual loading screen.

4.2.2
Released July 13, 2017
- (Fix) Fixed broken validation tooltip when configuring formula and rollup expressions.

4.2.1
Released July 11, 2017
- (Fix) Accessibility fixes to links in reports list view.

4.2.0
Released May 16, 2017
- (Fix) Fixed a formatting issue in the report data loading status indicator that caused the estimated load time to appear much longer than it would actually take.
- (Fix) Fixed a bug where, when removing a shared group or user, the correct group or user was removed from the report configuration but a different group or user could disappear from the list in the UI.
- (Fix) Fixed a bug where adjacent column values bled over into the Epic Link column if the row had no value for the Epic Link field.
- (Fix) Fixed a bug where very long report names caused the buttons in the report header to be displayed incorrectly.
- (Fix) Removed a broken link in the Filtering pane.

4.1.1
Released May 8, 2017
- (Fix) Fixed a regression introduced in 4.1.0 that broke group-based sharing in some scenarios.

4.1.0
Released May 8, 2017
- (Improvement) The report creation workflow now includes selecting a data source rather than defaulting to All issues.
- (Fix) Fixed a bug where the Search bar disappeared from the View reports screen after typing in a query that didn't produce any results.

4.0.4
Released April 24, 2017
- (Fix) Fixed a regression introduced in 4.0.0 that caused sharing a report with new users or groups to fail in certain conditions.

4.0.0
Released April 17, 2017
Data sources
A new Data source pane in report settings allows report administrators to more easily configure which JIRA issues will be available to the report. Available data sources are:
- Select a project
- Select a board
- Select a filter
- Enter a JQL query
- All issues
Manually configuring a JQL query as the data source works the same as it used to, but this setting has been moved from the Filtering pane to the Data source pane:

Other data sources will determine which issues to include as follows:
- Select a project will include all issues belonging to the specified project
- Select a board will include all issues returned by the JQL query of the filter that the specified board is configured to use
- Select a filter will include all issues returned by the JQL query of the specified filter
- All issues will include all issues that the report viewer has permission to access

Other notes:
- The default data source when creating new reports is still All issues, though this is likely to change in a future release.
- When using a data source that relies on an external JQL query (Select a board, Select a filter), the report will always use the current query rather than the query as it existed at the time of report creation.
- All existing reports have been migrated. Reports that had specified JQL queries previously are now set to the Enter a JQL query data source and the existing query will remain intact. Reports that did not specify JQL queries previously are now set to the All issues data source.
- Due to limitations of the JIRA API, when using Select a filter as the data source, only filters that the active report administrator owns or has added to favourites will be available in the filter selection dropdown – it is unfortunately not currently possible to retrieve a list of all filters that a user has permission to access from the JIRA API. To select a filter that doesn't show up in the list, the report administrator must first locate the filter and add it to favourites.
Data loading status indicator
When running reports with a data source that returns a lot of issues, it can take quite a while to fetch all of the issue data from JIRA before the report can be displayed. Previously, a loading message and spinner icon were displayed, but it was still not always clear whether the data was really still loading or if something had silently failed. In this release, a robust status indicator has been added to supply much more detailed feedback to the end user about how the data load is progressing.
Whenever a data load is attempted, the indicator will be displayed at the top of the report. Information will always include the number of issues returned by the specified data source and the progress in terms of the number of issues that have been loaded thus far (both as a percentage and with a graphical progress bar).

When the configured data source returns a large number of issues (1,000+) that must be fetched in multiple batches, the indicator will turn yellow and display a warning to the user including the estimated time required to complete the fetch.

If an error does happen to occur during the fetch, the indicator will turn red and display an error message to the user including the details of what went wrong. In this example, an invalid JQL query was configured as the data source.

Report display preferences
A new "Display preferences" button is now visible when viewing or configuring a report. This menu will contain controls related to runtime display preferences.
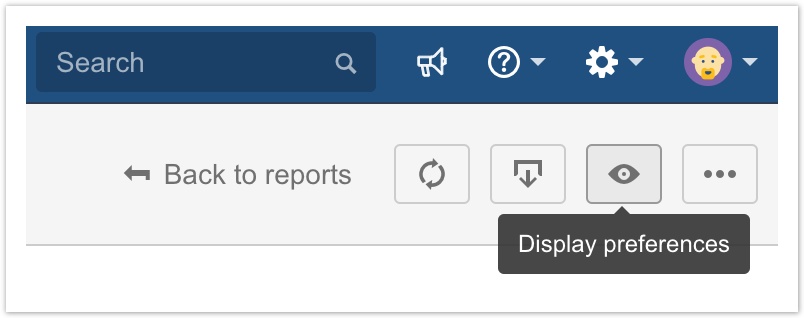
Initially, there are two controls available:
- Expand all grouping levels, which opens all grouping levels so you can see the individual issue data
- Collapse all grouping levels, which closes all grouping levels so you only see the summary data
These are user-specific display preferences that are not saved as part of the report configuration, and therefore will reset each time the report is viewed. As was the case previously, grouping levels will begin in an expanded state when the report is initially viewed.
Other changes
- (Fix) Fixed a crash caused by a report data load continuing to run in the background after the user has navigated away from the report. In-progress fetches are now aborted as soon as a user selects a different data source or navigates away from the report.
- (Fix) The previous method of fetching data for Epic Links proved somewhat unreliable and has been replaced by a more reliable and efficient method.
- (Fix) Fixed a crash caused by configured grouping, sorting or aggregation rules referencing a field that no longer exists in JIRA. The invalid rules are now identified and simply skipped during processing.
- (Change) Updated various language to match recent upstream changes to JIRA – most notably, "Report settings" is now used in favour of "Configure report".
- (Change) The Filtering pane has been updated with temporary help text until filtering rules are made available in an upcoming release.

3.5.0
Released March 2, 2017
- (Maintenance) Ensure support for Atlassian Connect JS v5 in advance of upcoming rollout.

3.4.0
Released January 13, 2017
- (Improvement) Display formatted, user-friendly error pages for server errors related to non-AJAX requests.
- (Maintenance) Improved logging to better identify and troubleshoot authentication problems.

3.3.0
Released January 12, 2017
- (Fix) Fixed a regression introduced in 3.2.0 which prevented new users from installing the add-on successfully.

3.2.0
Released January 11, 2017
- (Improvement) Display more informative error pages to users attempting to access the add-on without a license or with an expired license.
- (Fix) Fixed a bug where the View Reports page could crash under certain circumstances due to missing user data.

3.1.0
Released December 26, 2016
- (Maintenance) Under-the-hood improvements to authentication system.
No end-user impacting changes are expected for this release - please raise a support request if you notice something out of the ordinary!

3.0.0
Released December 23, 2016
- (Maintenance) Major internal refactoring, including removal of Atlassian Connect Express as a core dependency.
No end-user impacting changes are expected for this release - please raise a support request if you notice something out of the ordinary!

2.6.1
Released December 14, 2016
- (Fix) Previously, end users could reach add-on pages (e.g. from a bookmark) without first logging into JIRA, and would receive a blank page due to missing authentication credentials. Users must now be logged in in order to reach add-on pages, and will receive an error message from JIRA if they are not logged in.

2.6.0
Released December 13, 2016
- (Maintenance) Various minor internal refactoring.
No end-user impacting changes are expected for this release - please raise a support request if you notice something out of the ordinary!

2.5.0
Released December 6, 2016
- (Maintenance) Various minor internal refactoring.
No end-user impacting changes are expected for this release - please raise a support request if you notice something out of the ordinary!

2.4.2
Released November 30, 2016
- (Improvement) Display a loading message while report data is loading and allow users to make configuration changes to the report while loading.

2.4.1
Released November 2, 2016
- (Fix) Prefetching turned out to be a bit too aggressive and was causing long initial load times in large JIRA instances - dialled back the prefetching a bit to find a more optimal balance between initial load time and subsequent report loads.

2.4.0
Released October 31, 2016
Exports
A new "Export" button is now visible when viewing or configuring a report. Exporting to Excel (CSV) format is available with this release, and various other export formats are planned for future releases. The exported CSV reflects the Filtering, Grouping and Sorting rules configured for the report, and Formula Fields are also supported. At this time, Aggregation Rules are not reflected in the CSV: we have more work to do to determine how to best display the aggregations in CSV format - suggestions on this topic are more than welcome!
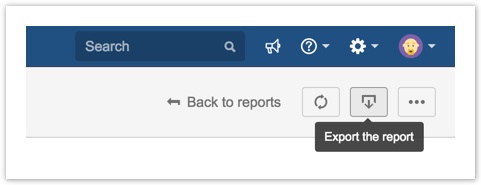
Note for Safari users: Safari does not currently expose the necessary API to allow the add-on to specify a filename for the export download - you will need to rename the downloaded file and add a .csv extension before opening the file in Excel or another CSV editor. This API is supported in Safari Technology Preview and will likely be included in a future stable release.
Other changes
- (Improvement) Improved UI performance across the board. Add-on data and JIRA data are now prefetched during add-on initialization and are cached much more aggressively, resulting in fewer API calls to JIRA during most operations and generally a snappier user experience when navigating within the add-on.
- (Improvement) The report header has been updated to match recent changes to JIRA's UI conventions: the Refresh and More Actions buttons are now more compact, with tooltips on hover. The Refresh button icon also animates during the refresh process and stops to indicate that the data has been successfully refreshed.
- (Improvement) All custom field types are now supported in Grouping and Sorting Rules.
- (Fix) Fixed a long-standing bug that caused Sorting Rules to not work reliably when sorting by fields containing arrays (e.g. Versions, Components).
- (Fix) Fixed a bug that required users to click the "Back to report" button a second time to return to the report view screen after discarding unsaved configuration changes.

2.3.2
Released August 19, 2016
- (Fix) Fixed a bug in the reports list that in some cases caused the Actions button to operate on the report adjacent to the one intended by the user.
- (Maintenance) Significantly improved logging capabilities to better identify and respond to bugs and infrastructure issues.

2.2.0
Released July 19, 2016
- (Fix) Fixed a bug that caused the reports list not to load after deleting a report from the configuration screen.
- (Security) Upgraded database to leverage more robust TLS-secured connection method and better isolation between environments.

2.1.3
Released July 15, 2016
- (Maintenance) Improved proactive error monitoring.
No end-user impacting changes are expected for this release - please raise a support request if you notice something out of the ordinary!

2.1.2
Released July 14, 2016
- (Maintenance) Various internal changes to improve reliability and ability to troubleshoot and resolve support requests.
No end-user impacting changes are expected for this release - please raise a support request if you notice something out of the ordinary!

2.1.1
Released June 2, 2016
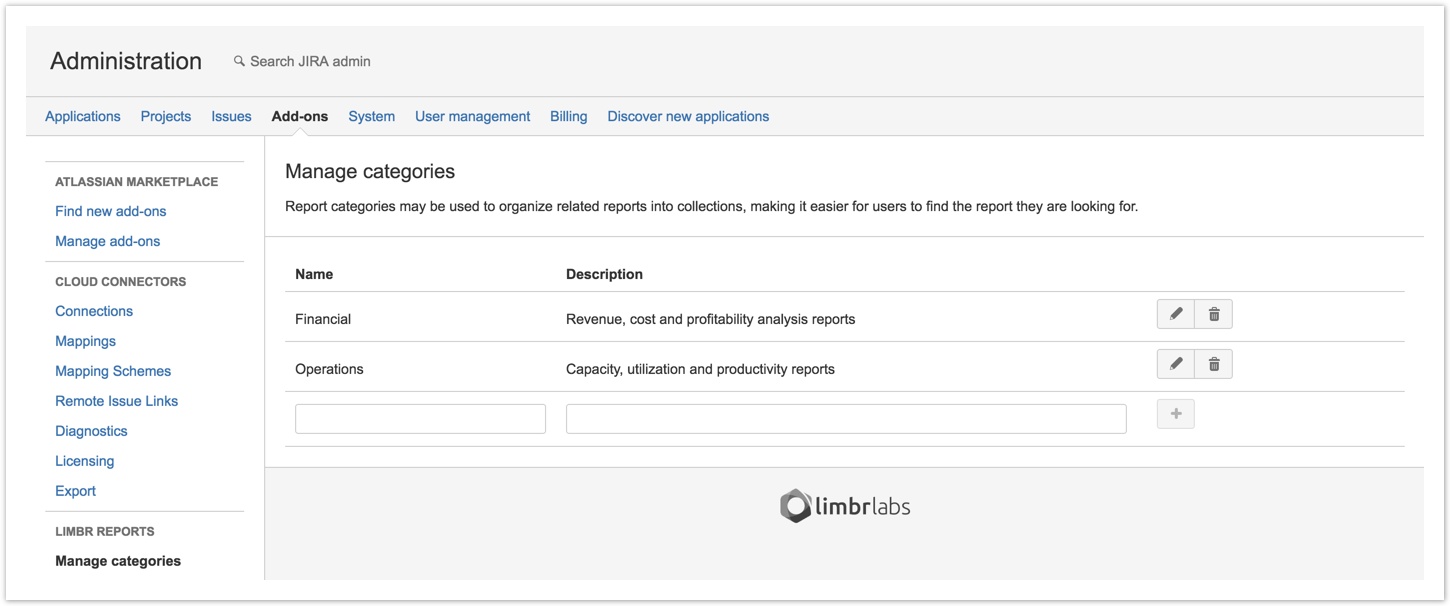
Categories
JIRA administrators can now create Categories to organize related reports into collections, improving discoverability and ease of management for a growing number of reports.
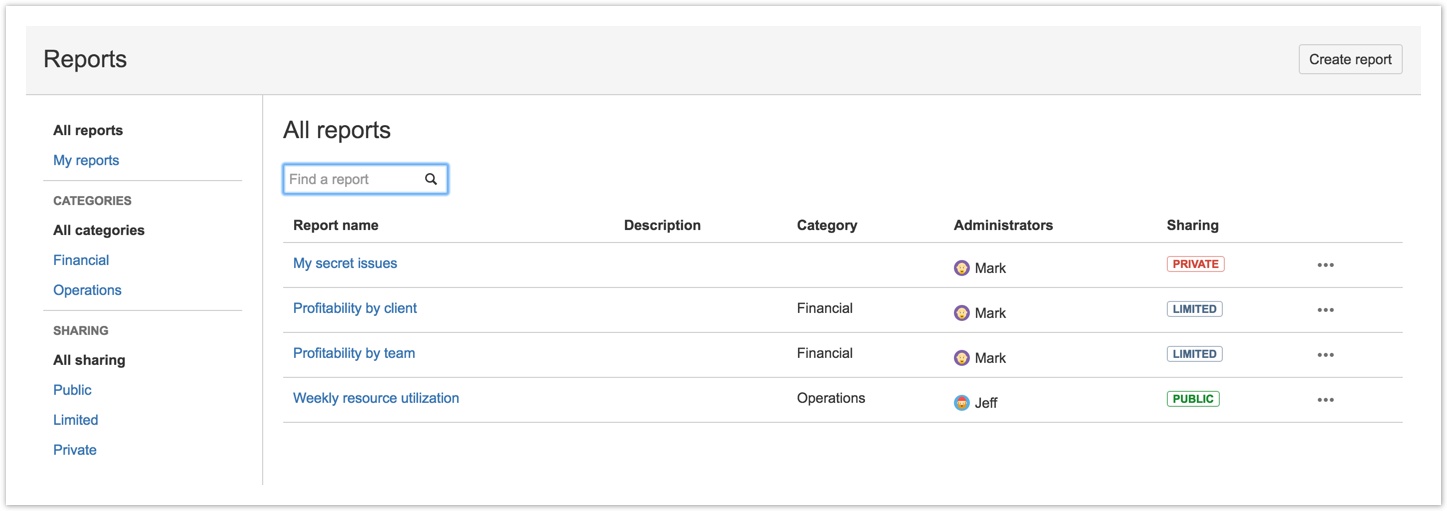
View Reports filtering and searching
Users can now narrow down the list of available reports in the View Reports screen to more easily find the report they are looking for. The list can be filtered to display only reports for which the user is an administrator (My reports), by Category, and by Sharing scope (Public, Limited or Private). The new search field at the top of the page filters the list by matching text in the report name and description.
Other changes
- (Improvement) The Epic Link field now displays the linked Epic's name rather than just the issue key.
- (Fix) Fixed a bug loading reports when one or more report administrators had user IDs containing special characters.

2.0.3
Released May 18, 2016
- (Fix) Fixed a regression that caused reports to no longer be listed in alphabetical order on the "View reports" screen.
- (Fix) Fixed multiple bugs manifesting for users that had changed their usernames after JIRA account creation.

2.0.0
Released May 17, 2016
This release of Limbr Reports adds two major features, plus numerous improvements and fixes.
Reports now respect configurable permissions that define which users can view, edit and delete each report:
Administrators
Administrators, configured in the General pane, are allowed to edit and delete reports. By default, the report creator is assigned as the sole Administrator. The creator may then assign additional Administrators to collaborate with, or transfer ownership of their report by assigning a new Administrator and removing themselves.

Reports created prior to this release don't have an Administrator assigned. The previous behaviour will remain intact for these reports, meaning any user can access the configuration screen or delete the report. In order to save changes to the report, at least one Administrator must be configured alongside any other changes. |
Sharing rules
Sharing rules, configured in the new Sharing pane, determine which users can view the report. There are three levels of sharing:
 Only configured Administrators can view the report (default).
 Specified users and/or groups can view the report.
 All logged-in users can view the report.

Reports created prior to this release are set to  by default, retaining the previous behaviour. by default, retaining the previous behaviour. |
Formula fields and rollup aggregation
Formula fields introduce the ability to define custom algebraic expressions that take regular JIRA fields (or other formula fields) as variables. Formula fields act just like regular JIRA fields - they can be displayed in reports as columns and used in sorting rules, grouping rules and aggregation rules. The difference is that the value displayed in formula fields is derived each time the report runs, rather than being stored in JIRA like other data. Formula fields help with a wide variety of reporting uses cases. Some basic examples include:
Each formula field may also specify an optional Rollup expression. A rollup is an aggregation method for summarizing report data, similar to sum or average. Rollups take aggregations of regular JIRA fields (or other formula fields) as variables. Like other supported aggregation methods, rollups are calculated for the entire report and for each configured grouping level. Building on the previous examples, rollups could be used to:
- Calculate the range of labour costs for all JIRA issues in a particular timeframe:
(aggregatetimespent.max - aggregatetimespent.min) * 65 - Estimate a group of features using the PERT technique:
(customfield_10012.sum + (4 * customfield_10013.sum) + customfield_10014.sum)/6 - Calculate the profit margin on an entire project:
(formula_revenue.sum - formula_cost.sum) / formula_revenue.sum
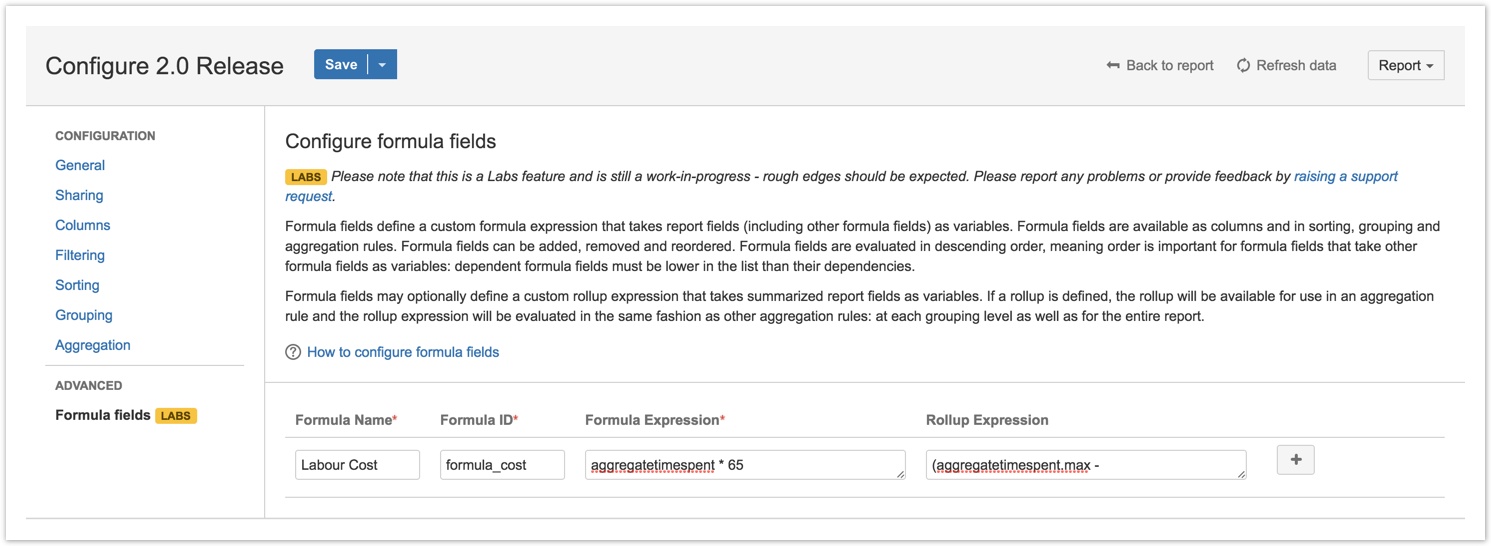
Formula fields are just the first of several features planned to enhance reports with user-defined data.
Formula fields are currently a Labs feature, meaning they are considered to be a work-in-progress. While the feature should be quite stable and usable, we are interested in user feedback to help further polish the experience of using formula fields in upcoming releases. |
Other changes
- (Improvement) Added a "Create a report" option to the main navigation dropdown.
- (Improvement) Added "Back to report" and "Back to reports" buttons to the report header.
- (Improvement) Reworked the menu for navigating between configuration panes. Using the browser's back and forward buttons to navigate between panes is now also possible.
- (Improvement) Added help text to each configuration pane.
- (Improvement) More descriptive error messages with additional help text and links to documentation where appropriate.
- (Improvement) The "Description" field is now available when creating or copying a report.
- (Change) Renamed the main navigation item from "Limbr" to "Reports" to make finding reports more obvious to new users.
- (Change) Renamed the "Data" configuration pane to "Filtering" to better reflect the scope of the pane.
- (Fix) Added better validation of report configurations when saving changes to prevent reports from getting stuck in an unusable state.
- (Security) Write access has been removed from the add-on's permission scope, meaning Limbr Reports no longer has the ability to persist data to your JIRA instance. We had not utilized our write access to date, and have decided to voluntary enforce this limitation through the Marketplace APIs simply as a precautionary measure.
1.12.2
Released May 3, 2016
- (Security) Emergency update to atlassian-connect-express dependency to patch recently disclosed security vulnerability.
1.12.0
Released April 24, 2016
- (Maintenance) Various preparations for upcoming 2.0.0 release.
No end-user impacting changes are expected for this release - please raise a support request if you notice something out of the ordinary!
1.11.0
Released March 21, 2016
- (Improvement) Replaced drag-and-drop style reordering of configuration rules in favour of simple up/down buttons. While a bit slicker in theory, the drag-and-drop implementation was unfortunately a bit flaky in practice and was slow when working with more 5-6 configuration rules - the buttons are much more responsive.
- (Improvement) When configuring columns, aggregation, grouping or sorting rules, fields that are already in-use are now removed from the selector.
- (Improvement) Removed the "Data Source" configuration option until other data sources are actually available.
- (Improvement) Improved user experience for identifying and resolving syntax errors in the configured JQL Query.
- (Fix) Fixed an issue that prevented the data table from updating after certain configuration changes.
- (Fix) Fixed an issue that caused the previous report's data to be displayed briefly after navigating to a different report.
1.10.0
Released March 19, 2016
- (Improvement) Display a "Loading" message when refreshing report data.
1.9.1
Released March 15, 2016
- (Maintenance) Additional refactoring, test coverage and optimizations.
- (Maintenance) Beefed up exception monitoring and crash reporting to proactively identify and resolve issues.
No end-user impacting changes are expected for this release - please raise a support request if you notice something out of the ordinary!
1.8.1
Released March 11, 2016
- (Maintenance) Additional refactoring, test coverage and optimizations.
No end-user impacting changes are expected for this release - please raise a support request if you notice something out of the ordinary!
1.7.0
Released March 6, 2016
- (Maintenance) Significant refactoring and foundational work for upcoming features.
No end-user impacting changes are expected for this release - please raise a support request if you notice something out of the ordinary!
1.6.1
Released March 3, 2016
- (Fix) Fixed a regression related to sorting of group segments.
- (Fix) Fixed an issue that caused duplicate group segments to be displayed under certain report configurations.
1.6.0
Released February 24, 2016
- (Improvement) Reports can now display an unlimited number of issues. Please note that very large reports (>1,000 issues) will be slower to render - while further optimizations are planned to improve rendering performance for large data sets, in the meantime, smaller data sets are still recommended where feasible.
1.5.0
Released February 8, 2016
- (Improvement) Reports can now display up to 1,000 issues. Warnings will be displayed in configuration mode if the configured JQL query returns more than 1,000 issues. Excess issues will be truncated from the report.
- (Improvement) All Reports list is now sorted.
1.3.0
Released February 5, 2016
- (Improvement) Components field is now supported.
1.2.2
Released February 2, 2016
- (Fix) Ordering of group segments now respects configured sorting rules, and falls back to alphabetical ascending if no sorting rules apply.
1.2.0
Released January 29, 2016
- (Improvement) Sprint and Tempo Account fields are now supported.
- (Fix) When grouping by fields that contain arrays of values (e.g. Versions, Sprints), a group segment is now created for each unique array value rather than each combination of array values. For example, for an issue with Affects Version/s containing "1.0, 1.1, 1.2", will now be included in three individual group segments ("1.0", "2.0" and "3.0") rather than a single group segment ("1.0, 2.0, 3.0").
1.1.0
Released December 12, 2015
- (Improvement) Grouping and sorting is now available for Version fields.
1.0.0
Released October 20, 2015
- Hello world! Initial release - create custom reports to slice and dice your JIRA issues!
- (Feature) Use a standard JQL Query to determine which issues are displayed as rows in the report.
- (Feature) Configure Columns to display specified issue fields as columns in the report.
- (Feature) Configure Sorting Rules to sort the report rows by one or more specified issue fields.
- (Feature) Configure Grouping Rules to segment the report rows by one or more specified issue fields.
- (Feature) Configure Aggregation Rules to summarize the report rows at the report and group level with built-in aggregation functions including sum, average, minimum and maximum.


